淘宝商品口红数据爬取与分析
数据来源:
爬取数据,网盘中包含爬取的数据与停词库
百度网盘 请输入提取码 6666
处理过程
导入数据:
import pandas as pd
data1 = pd.read_excel("kouhong_good.xlsx")
data1.head()
data1.drop(['comment_url'],axis= 1,inplace = True)将数据店铺分类:
def store(e):
    if '天猫' in e:
        return '天猫店铺'
    elif '旗舰店' in e:
        return '旗舰店'
    elif '专营店' in e:
        return '专营店'
    elif '企业店' in e:
        return '企业店铺'
    else:
        return '自营店铺'
data1['store_type'] = data1['store'].apply(store)
data1.drop(['store'],axis = 1,inplace = True)
data1.head()处理销量与价格:
import re
def delete(e):
    if '人收货' in e:
        return e.replace('人收货','')
def price(e):
    if '万+' in e:
        num1 = re.findall('(.*?)万+',e)
        return float(num1[0])*10000
    elif '+' in e:
        return e.replace('+','')
    else:
        return float(e)
data1['store_sales'] = data1['sales'].apply(delete).apply(price)
data1.drop(['sales'],axis = 1,inplace = True)
data1.head()
品牌分类:
def classify(e):
    if'Mac' in e:
        return 'MAC'
    elif'魅可'in e:
        return 'MAC'
    elif'Dior'in e:
        return 'Dior'
    elif 'Givenchy'or'纪梵希' in e:
        return 'Givenchy'
    else :
        return 'Others'
data1['brand'] = data1['title'].apply(classify)
data1['brand'] = data1['title'].apply(classify)
data1.head(20)处理商铺地点:
def location(e):
    return e.split(' ')[0]
data1['store_location'] = data1['location'].apply(location)
data1.drop(['location'],axis = 1,inplace = True)
data1.head(5)
处理价格,删去不合理价格
list = data1[data1['price']<51].index.tolist()
print(list)
data1.drop([54, 93, 104, 162, 173, 457, 500, 541, 551, 654, 674, 685, 705, 726, 789, 823, 837, 847, 851, 949, 956, 1061, 1127, 1128, 1130, 1136, 1137, 1151, 1175, 1193, 1241, 1269, 1308, 1323, 1360, 1380, 1388, 1407, 1459, 1462, 1479, 1483, 1503, 1531, 1544, 1553, 1558, 1572, 1589, 1590, 1624, 1630, 1673, 1703, 1721, 1726, 1779, 1791, 1798, 1812, 1852, 1862, 1935, 1945],inplace = True)
data1
data1['store_sales'] = data1['store_sales'].astype(int)data1['sales_money'] = data1['price']*data1['store_sales']
data1
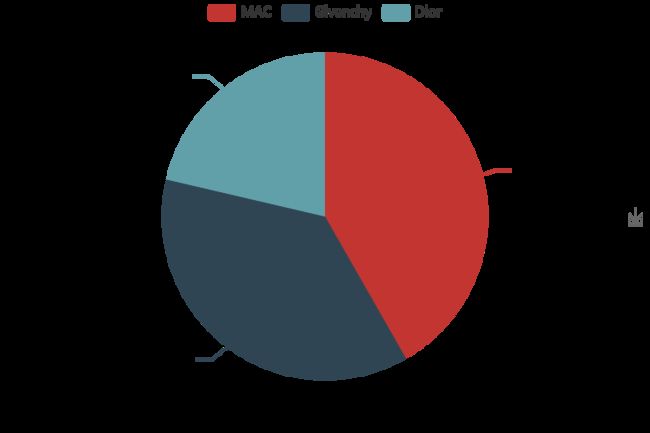
品牌占比:
b = [b[0]/m,b[1]/m,b[2]/m]
print(b)
from pyecharts import Pie
pie = Pie("口红品牌比例",width = 600,height = 400)
pie.add("", a, b, is_label_show=True)
pie.render('1.html')
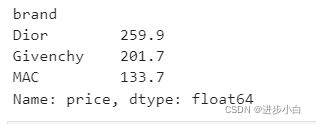
data1['price'].groupby(data1['brand']).sum()brand_mean = round(data1['price'].groupby(data1['brand']).mean(),1)
brand_mean
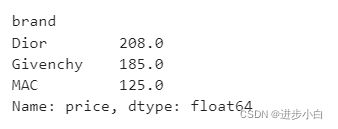
brand_median = data1['price'].groupby(data1['brand']).median()
brand_median
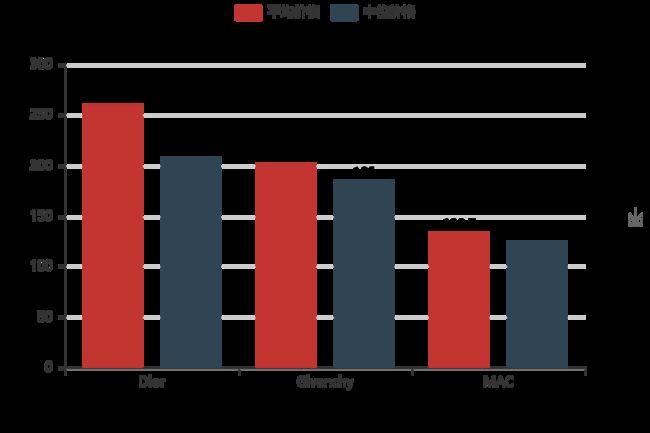
不同价格概况:
from pyecharts import Bar
name = ['Dior','Givenchy','MAC']
bar = Bar("不同品牌价格概况",width = 600,height = 400)
bar.add('平均价格',name,brand_mean,is_label_show = True,
        xaxis_label_textsize = 25,yaxis_label_textsize = 15)#,xaxis_rotate = 30
bar.add('中位价格',name,brand_median,is_label_show = True,
        xaxis_label_textsize = 25,yaxis_label_textsize = 15)
bar.render('2.html')
all_sale = round(data1['sales_money'].groupby(data1['brand']).sum(),1)
all_saledata2 = data1.pivot_table(values=['sales_money'], index=['brand', 'store_type'])
data2
def transform(e):
    return int(e)
data2['sale_money'] = data2['sales_money'].apply(transform)
data2.drop(['sales_money'],axis = 1,inplace = True)
name2 =["Dior", "Givenchy", "MAC"]
bar1=Bar('不同品牌销售额概况',width = 800,height = 500)
bar1.add('',name2,all_sale,is_label_show = True)
bar1.render('3.html')
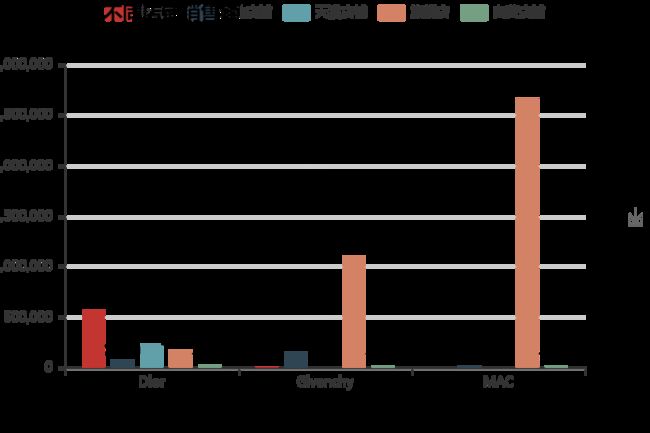
bar2=Bar('不同品牌之不同店铺销售额',width = 600,height = 400)
bar2.add('专营店',name2,[561673,1683,0],is_label_show = True)
bar2.add('企业店铺',name2,[74099,152569,16789],is_label_show = True)
bar2.add('天猫店铺',name2,[224795,0,0],is_label_show = True)
bar2.add('旗舰店',name2,[165455,1103268,2657514],is_label_show = True)
bar2.add('自营店铺',name2,[19276,12157,10958],is_label_show = True)
bar2.render('4.html')地点处理:
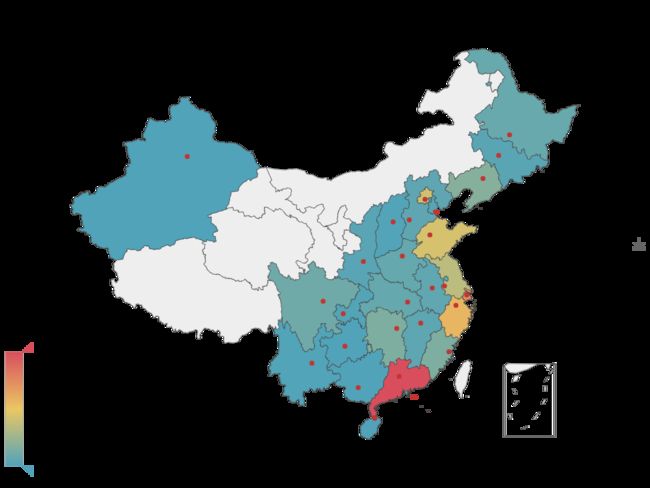
data1['store_location'].value_counts()location =['广东','上海','浙江','山东','北京','江苏','辽宁','湖南','福建','四川','黑龙江', '湖北', '河南', '安徽', '河北', '江西','吉林', '香港','陕西', '天津', '重庆', '山西', '云南', '广西','贵州','海南', '新疆']
number = [414, 305, 236, 180, 171, 144, 72, 62, 62, 43, 32, 28, 28, 22, 20, 19, 14, 14, 13, 12, 6, 4, 3, 2, 1, 1, 1]from pyecharts import Map
map0 = Map("店铺地址分布图",width=800, height=600)
map0.add("", location, number, visual_range=[0, 414],maptype="china", is_visualmap=True, visual_text_color='#000',is_label_show=True)
map0.render("5.html")
data1['title'] = data1['title'].astype(str)
import jieba
import jieba.analyse
def cut_word(text):
text = jieba.cut(str(text),cut_all=False)
return ' '.join(text)data1['new_title'] = data1['title'].apply(cut_word)
data1with open(r'.\words.txt','r',encoding='utf-8')as f:
print(f)
words = f.read()
f.close
print(words)关键词占比:
jieba.analyse.set_stop_words(r'.\stoplist.txt')
new_words = jieba.analyse.textrank(words, topK=20, withWeight=True)
print(new_words)
last_words = []
for i in range(20):
    a = new_words[i][0]
    last_words.append(a)
print(last_words)
last_rank = []
for i in range(20):
    b = new_words[i][1]
    last_rank.append(b)
print(last_rank)
制作词云:
from pyecharts import WordCloud
wordcloud=WordCloud(width=600,height=400)
wordcloud.add('',last_words,last_rank,word_size_range=[20,100])
wordcloud.render("7.html")
data2 = pd.read_csv('Dior_kouhong_data.csv')
data3 = pd.read_csv('Givenchy_kouhong_data.csv')
data4 = pd.read_csv('mac_kouhong_data.csv')
print(data2)
print(data3)
print(data4)from snownlp import SnowNLP
data = pd.concat([data2,data3,data4],axis = 0)
data = data.reset_index(drop=True)
datadata = data[~data['口红评价'].isin(['此用户没有填写评论!'])]
the_data = data
datadef length(e):
if len(e)<=10:
return '0'
else :
return '1'data['num'] = data['口红评价'].apply(length)
datadata = data[~data['num'].isin(['0'])]
data.drop(['num'],axis = 1,inplace = True)
data = data.reset_index(drop=True)
datadata['评价'] = data['口红评价'].apply(cut_word)
datawith open(r'.\words2.txt','r',encoding='utf-8')as f:
words2 = f.read()
f.close
print(words2)last_words2 = []
for i in range(20):
a = new_words2[i][0]
last_words2.append(a)
print(last_words2)
last_rank2 = []
for i in range(20):
b = new_words2[i][1]
last_rank2.append(b)
print(last_rank)云图:
wordcloud=WordCloud(width=600,height=400)
wordcloud.add('',last_words2,last_rank2,word_size_range=[20,100])
wordcloud.render("8.html")
new_data = data.drop(['评价'],axis = 1)
new_data
re模块寻找关键词:
import re
k_list = []
last_list = []
keyword = input('请输入想查找的关键词:')
for i in new_data['口红评价']:
    if keyword in i :
        k_list.append(i)
for j in k_list:
    a = new_data[new_data['口红评价'].isin([j])].index.tolist()[0]
    last_list.append(a)
new_data.loc[last_list]
last_data = pd.concat([data2,data3,data4],axis = 0)
last_data = last_data.reset_index(drop=True)
last_datadef the_brand(e):
if 'Dior' in e:
return 'Dior'
elif 'Givenchy' in e:
return 'Givenchy'
elif 'Mac' in e:
return 'Mac'
def the_del(e):
if 'Dior' in e:
return e.replace('Dior:','')
elif 'Givenchy' in e:
return e.replace('Givenchy:','')
elif 'Mac' in e:
return e.replace('Mac:','')last_data['the_brand'] = last_data['颜色Color'].apply(the_brand).apply(the_del)
last_data['Color'] = last_data['颜色Color'].apply(the_del)
#last_data.drop(['颜色Color'],axis = 1,inplace = True)
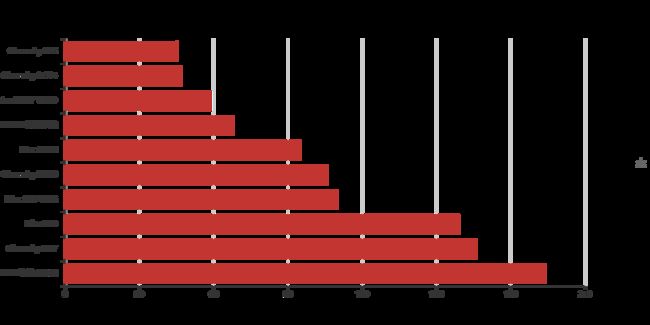
last_datalast_data['the_brand'].value_counts()m = last_data['颜色Color'].value_counts().head(10).index.tolist()
n = last_data['颜色Color'].value_counts().head(10).values.tolist()
print(m)
print(n)bar = Bar('不同色号售卖概况',width = 1000,height = 500,title_text_size = 25)
bar.add('',m,n,is_convert = True)
bar.render('10.html')再次引入,准备情感分析:
df1 = pd.read_csv('Dior_kouhong_data.csv')
df2= pd.read_csv('Givenchy_kouhong_data.csv')
df3 = pd.read_csv('mac_kouhong_data.csv')
data['emotion'] = data['口红评价'].apply(lambda x:SnowNLP(x).sentiments)
data.head()#积极情感分析df1['emotion'] = df1['口红评价'].apply(lambda x:SnowNLP(x).sentiments)
data2.head()#积极情感分析df2['emotion'] =df2['口红评价'].apply(lambda x:SnowNLP(x).sentiments)
df3['emotion'] = df3['口红评价'].apply(lambda x:SnowNLP(x).sentiments)
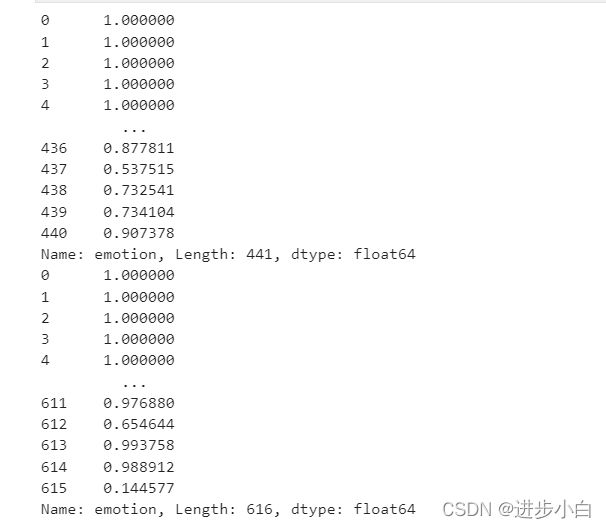
print(df2['emotion'])
print(df3['emotion'])
df1['emotion'].describe()
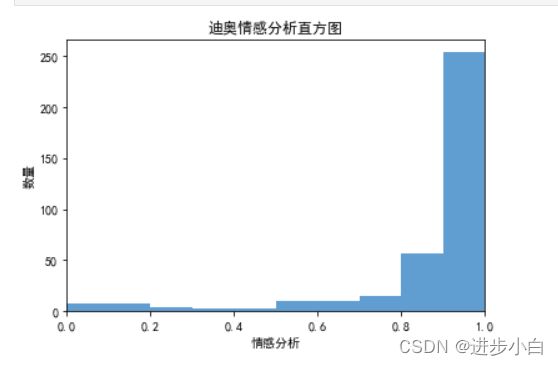
#emotion的均值是0.871
import matplotlib.pyplot as plt
import numpy as np
plt.rcParams['font.sans-serif']=['SimHei']
plt.rcParams['axes.unicode_minus'] = False
bins=np.arange(0,1.1,0.1)
plt.hist(df1['emotion'],bins,color='#4F94CD',alpha=0.9)
plt.xlim(0,1)
plt.xlabel('情感分析')
plt.ylabel('数量')
plt.title('迪奥情感分析直方图')
plt.show()
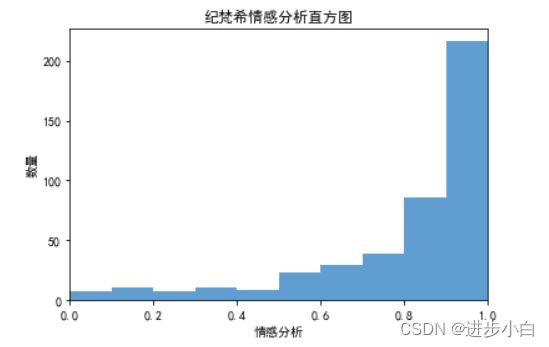
import matplotlib.pyplot as plt
import numpy as np
plt.rcParams['font.sans-serif']=['SimHei']
plt.rcParams['axes.unicode_minus'] = False
bins=np.arange(0,1.1,0.1)
plt.hist(df2['emotion'],bins,color='#4F94CD',alpha=0.9)
plt.xlim(0,1)
plt.xlabel('情感分析')
plt.ylabel('数量')
plt.title('纪梵希情感分析直方图')
plt.show()
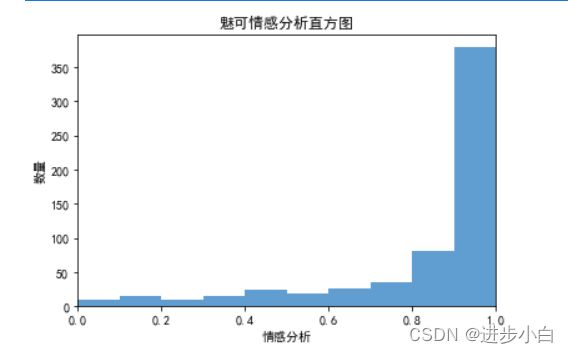
import matplotlib.pyplot as plt
import numpy as np
plt.rcParams['font.sans-serif']=['SimHei']
plt.rcParams['axes.unicode_minus'] = False
bins=np.arange(0,1.1,0.1)
plt.hist(df3['emotion'],bins,color='#4F94CD',alpha=0.9)
plt.xlim(0,1)
plt.xlabel('情感分析')
plt.ylabel('数量')
plt.title('魅可情感分析直方图')
plt.show()
pos_nlp1 = 0
neg_nlp1 = 0
for i in df1['emotion']:
    if i >= 0.5:
        pos_nlp1 += 1
    else:
        neg_nlp1 += 1
print('积极评论,消极评论数目分别为:',pos_nlp1,neg_nlp1)
查看占比:
plt.rcParams['font.sans-serif']=['SimHei']
plt.rcParams['axes.unicode_minus'] = False
pie_labels='postive','negative'
plt.pie([pos_nlp1,neg_nlp1],labels=pie_labels,autopct='%1.1f%%',shadow=True)
plt.show()
其他如此。
#评论的长短可以看出评论者的认真程度
import seaborn as sns
df1['认真程度'] = df1['口红评价'].str.len()
fig2, ax2=plt.subplots()
sns.scatterplot(x='emotion',y='认真程度',data=df1, ax=ax2)
ax2.set_ylim(0,300)
进行特征处理,对模型进行评分:
with open(r'stoplist.txt', encoding='utf-8') as file:
    word_list = [x.strip() for x in file.readlines()]
def SetLabel(score):
if score >=0.6:
return 1
else:
return 0
data['emotion'] = data['emotion'].map(lambda x:SetLabel(x))#数据集拆分为语料、标签
terms = data['口红评价'].tolist()
y = data['emotion'].tolist()
from sklearn.feature_extraction.text import TfidfVectorizer as TFIV
# 初始化TFIV对象,去停用词,加2元语言模型
tfv = TFIV(min_df=3, max_features=None, strip_accents='unicode', analyzer='word',token_pattern=r'\w{1,}',
ngram_range=(1, 2), use_idf=1,smooth_idf=1,sublinear_tf=1, stop_words = word_list)
tfv.fit(terms)
X_all = tfv.transform(terms)#特征选择
from sklearn.feature_selection import SelectKBest, chi2
select_feature_model = SelectKBest(chi2, k=100)
##卡方检验来选择100个最佳特征
X_all = select_feature_model.fit_transform(X_all, y) from sklearn.model_selection import train_test_split
x_train, x_test, y_train, y_test = train_test_split(X_all, y, random_state=0, test_size=0.25)from sklearn.naive_bayes import MultinomialNB as MNB
model_NB = MNB()
model_NB.fit(x_train, y_train)
MNB(alpha=1.0, class_prior=None, fit_prior=True)
from sklearn.model_selection import cross_val_score
#评估预测性能,减少过拟合
print("贝叶斯分类器20折交叉验证得分: ", np.mean(cross_val_score(model_NB, x_train, y_train, cv=20, scoring='roc_auc'))) 贝叶斯分类器20折交叉验证得分: 0.675626876876877
from sklearn.linear_model import LogisticRegression
from sklearn.linear_model import LogisticRegression as LR
from sklearn.model_selection import GridSearchCV
model_LR = LogisticRegression(C=.01) # C是正则化系数。
model_LR.fit(x_train, y_train)
print("20折交叉验证得分: ", np.mean(cross_val_score(model_LR, x_train, y_train, cv=20, scoring='roc_auc')))
20折交叉验证得分: 0.7045076326326327
from sklearn.svm import LinearSVC
model_SVM = LinearSVC(C=.01) # C是正则化系数。
model_SVM.fit(x_train, y_train)
print("20折交叉验证得分: ", np.mean(cross_val_score(model_SVM, x_train, y_train, cv=20, scoring='roc_auc')))
20折交叉验证得分: 0.701445820820821
欢迎大家订正与修改讨论,总过程代码放在项目中可以下载学习。
