机器学习--线性回归
引入
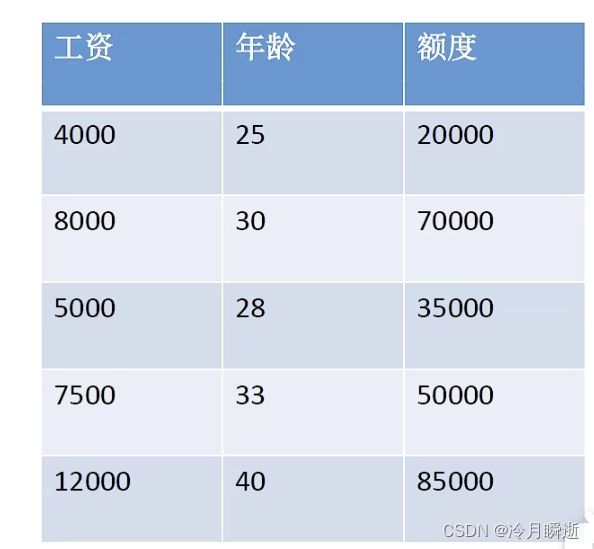
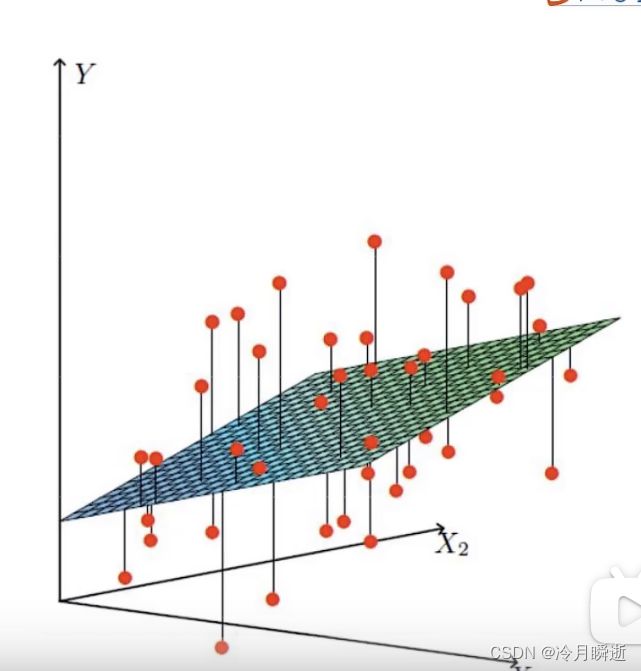
设h为额度,x1为工资,x2为年龄,使用线性拟合的方式,即找出一个平面使得额度的值都接近这个平面上的值,如图,可得出关系式为
h(x)=θ0+θ1x1+θ2x2
为便于转换为矩阵运算,则添加x0项使得(x0=1),即
h(x)=θ0x0+θ1x1+θ2x2
误差
真实值与我们算出的预测值一般存在误差
所以对于每个样本都有如下公式:

由此得出机器学习即是给出数据集,使用关系式让机器去根据关系式处理数据,即机器学习的过程,目的是使得误差值越小越好。
误差是独立并且具有相同的分布,并且服从均值为0,方差为θ^2的高斯分布
独立:即张三和李四一起来贷款,但不互相影响
同分布:即他俩来的都是我们的这一家银行
高斯分布:银行可能多给少给,但是绝大多数情况下浮动不会太大,极小情况浮动会比较大,符合正常情况,。
似然函数
似然函数与对数似然


求出L(θ)的极大值点,则得出我们想要的θ,即可代入原来的关系式h(x)。
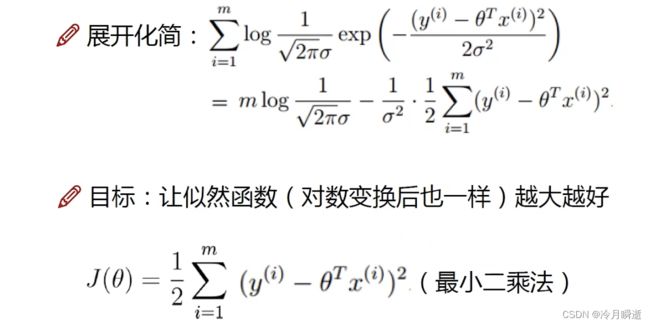
展开化简与计算目标:
梯度下降
梯度下降相当于一个“下山”的过程,寻找山谷的最低点(即极值点),就是目标函数的终点。
下山应分三步:
(1)找到当前最合适的方向;
(2)每次走一小步,走快就会“跌倒”;
(3)按照方向与步伐更新参数。
梯度下降的类型如下:
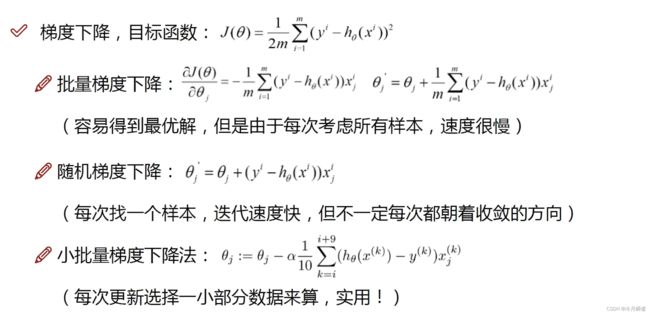
学习率(步长):对结果会产生巨大的影响,一般较小
批处理数量:32,64,128都可以,很多时候考虑内存和效率。
代码部分
预处理模块
    def __init__(self,data,labels,polynomial_degree = 0,sinusoid_degree = 0,normalize_data=True):
        """
        1.对数据进行预处理操作
        2.先得到所有的特征个数
        3.初始化参数矩阵
        """
        (data_processed,
         features_mean,
         features_deviation)  = prepare_for_training(data, polynomial_degree, sinusoid_degree,normalize_data=True)

        self.data = data_processed
        self.labels = labels
        self.features_mean = features_mean
        self.features_deviation = features_deviation
        self.polynomial_degree = polynomial_degree
        self.sinusoid_degree = sinusoid_degree
        self.normalize_data = normalize_data

        num_features = self.data.shape[1]
        self.theta = np.zeros((num_features,1))
梯度下降模块
"""
计算预测值predictions
"""
    def hypothesis(data,theta):
        predictions = np.dot(data,theta)
        return predictions
 def gradient_step(self,alpha):
        """
                    梯度下降参数更新计算方法,注意是矩阵运算
        """
        num_examples = self.data.shape[0]
        prediction = LinearRegression.hypothesis(self.data,self.theta)
        delta = prediction - self.labels
        theta = self.theta
        theta = theta - alpha*(1/num_examples)*(np.dot(delta.T,self.data)).T
        self.theta = theta
损失计算模块
 def cost_function(self,data,labels):
        """
                    损失计算方法
        """
        num_examples = data.shape[0]
        delta = LinearRegression.hypothesis(self.data,self.theta) - labels
        cost = (1/2)*np.dot(delta.T,delta)/num_examples
        return cost[0][0]
迭代模块
    def gradient_descent(self,alpha,num_iterations):
        """
                    实际迭代模块,会迭代num_iterations次
        """
        cost_history = []
        for _ in range(num_iterations):
            self.gradient_step(alpha)
            cost_history.append(self.cost_function(self.data,self.labels))
        return cost_history
在这里插入代码片
训练模块
 def train(self,alpha,num_iterations = 500):
        """
                    训练模块,执行梯度下降
        """
        cost_history = self.gradient_descent(alpha,num_iterations)
        return self.theta,cost_history
绘制训练和测试数据的散点图
import numpy as np
import pandas as pd
import matplotlib.pyplot as plt

from linear_regression import LinearRegression

data = pd.read_csv('../data/world-happiness-report-2017.csv')

# 得到训练和测试数据
train_data = data.sample(frac = 0.8)
test_data = data.drop(train_data.index)

input_param_name = 'Economy..GDP.per.Capita.'
output_param_name = 'Happiness.Score'

x_train = train_data[[input_param_name]].values
y_train = train_data[[output_param_name]].values

x_test = test_data[input_param_name].values
y_test = test_data[output_param_name].values

plt.scatter(x_train,y_train,label='Train data')
plt.scatter(x_test,y_test,label='test data')
plt.xlabel(input_param_name)
plt.ylabel(output_param_name)
plt.title('Happy')
plt.legend()
plt.show()
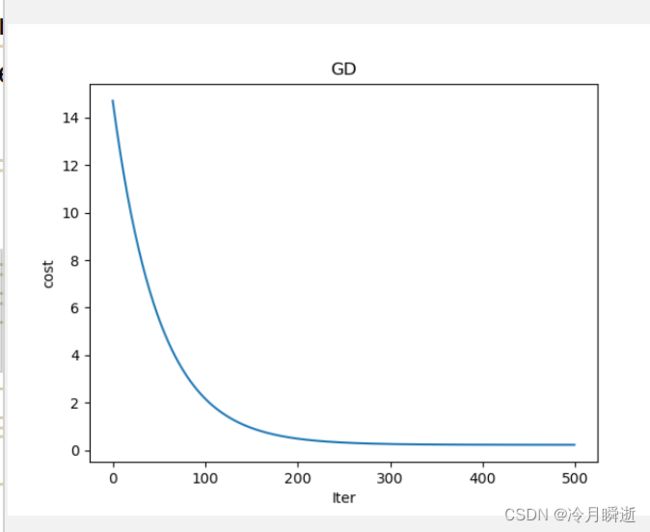
绘制损失与迭代次数的曲线
num_iterations = 500
learning_rate = 0.01

linear_regression = LinearRegression(x_train,y_train)
(theta,cost_history) = linear_regression.train(learning_rate,num_iterations)

print ('开始时的损失:',cost_history[0])
print ('训练后的损失:',cost_history[-1])

plt.plot(range(num_iterations),cost_history)
plt.xlabel('Iter')
plt.ylabel('cost')
plt.title('GD')
plt.show()
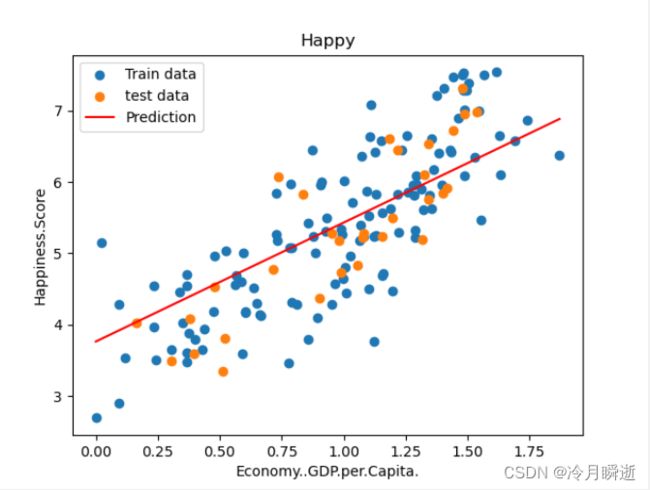
绘制拟合曲线
predictions_num = 100
x_predictions = np.linspace(x_train.min(),x_train.max(),predictions_num).reshape(predictions_num,1)
y_predictions = linear_regression.predict(x_predictions)

plt.scatter(x_train,y_train,label='Train data')
plt.scatter(x_test,y_test,label='test data')
plt.plot(x_predictions,y_predictions,'r',label = 'Prediction')
plt.xlabel(input_param_name)
plt.ylabel(output_param_name)
plt.title('Happy')
plt.legend()
plt.show()
