Matplotlib - 2. 绘制线 (line) / 点(marker)
说明:可能 Matplotlib.pyplot.plot 官方文档 的英文内容和排版对于初学者来说不太友好,所以我对它的内容进行了归纳和总结!【ps: 至少我本人很喜欢归纳完的东西,感觉有条理】
1. API 格式及说明
plot([x], y, [fmt], *, data=None, **kwargs) # 同一个图绘制单线
plot([x], y, [fmt], [x2], y2, [fmt2], ..., **kwargs) # 同一个图里绘制多条线
(1) x, y: 传入的x 坐标和y坐标的值,类型为 list 或者 numpy.array。如果x没有传入值,则默认为 range(len(y)),也就是 [0, 1 .... len(y)-1]
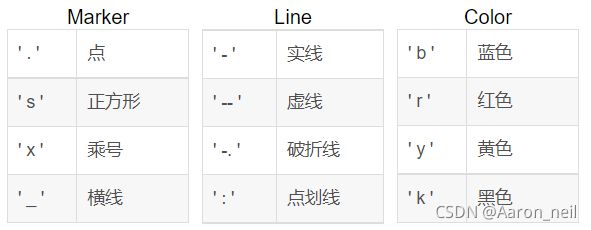
(2) fmt:传入的是线/ 点的基本格式: fmt = '[marker][line][color]' 类型为 str。其中:我只列举部分常用示例,全部的示例可参考:matplotlib.pyplot.plot — Matplotlib 3.4.3 documentation
所以 fmt 可表示如下:( '-r : 红色实线 ) ('y--': 红色虚线) ('s-b': 点是正方形的蓝色实线) 默认为 '-b'
(3) data: 带标签/索引的数据,如dict,pandas.DataFame 等,可以用 data['x'] / data['y'] 来表示x / y
import matplotlib.pyplot as plt

test_dict = {
    'a': [1, 2, 3, 4, 5],
    'b': [6, 2, 2, 1, 3]
}
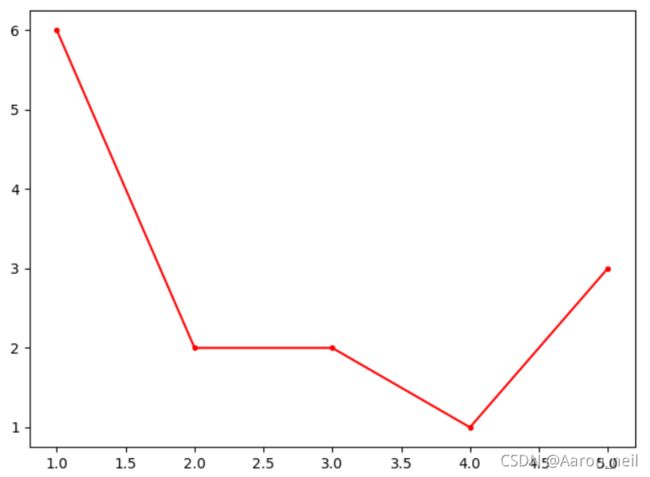
plt.plot('a', 'b', '.-r', data=test_dict)
plt.show()
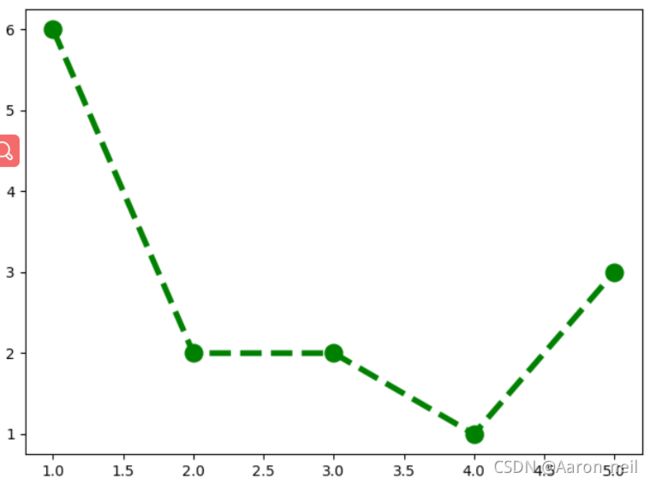
(4) 关键字参数:**kwargs。可以使用Line2D属性作为关键字参数,以便对外观进行更多控制。Line2D属性可以和 fmt 混用,在属性重复下**kwargs优先级高,示例如下:
【Line2D的属性 color = 'red' 和 fmt 中的 'g'(绿色) 重复,但结果展示红色】
import matplotlib.pyplot as plt

x = [1, 2, 3, 4, 5]
y = [6, 2, 2, 1, 3]
plt.plot(x, y, 'ro--', linewidth=4, markersize=12, color='green')
plt.show()
2. 绘制多组数据
有几种方式都可以实现在一张图中绘制多组数据
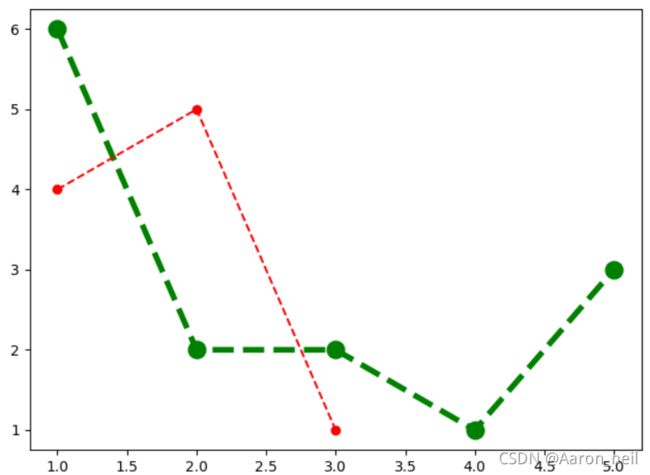
(1) 第一种就是很简单的方式,即多次执行plot函数
import matplotlib.pyplot as plt

x = [1, 2, 3, 4, 5]
x1 = [1, 2, 3]
y = [6, 2, 2, 1, 3]
y1 = [4, 5, 1]
plt.plot(x, y, 'ro--', linewidth=4, markersize=12, color='green')
plt.plot(x1, y1, 'ro--')
plt.show()
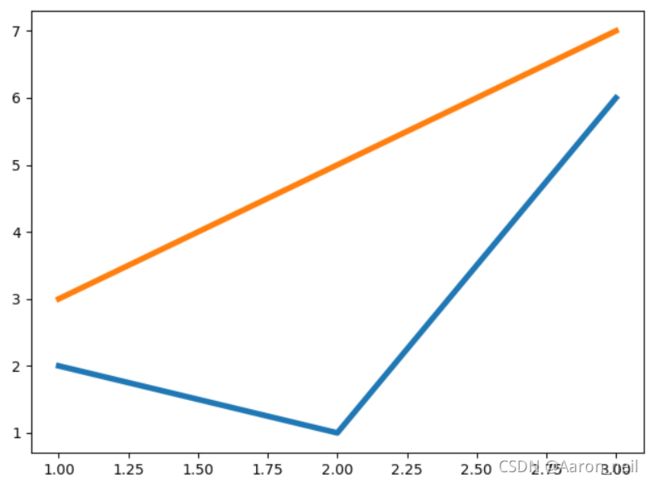
(2) 第二种是 2D arrays,x 对应多个y值。
如 x = [1, 2, 3] y = np.array([[2, 3], [1, 5], [6, 7]])。转换成线的意思就是有两组线:( x = [1, 2, 3], y = [2, 1, 6] ) 和 (x = [1,2,3], y = [3,5,7])
import numpy as np
import matplotlib.pyplot as plt

x = [1, 2, 3]
y = np.array([[2, 3], [1, 5], [6, 7]])
plt.plot(x, y, linewidth=4)
plt.show()
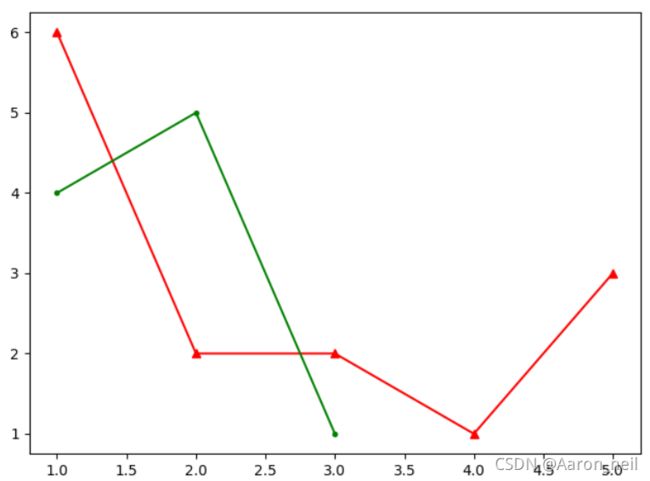
(3) 第三种就是在 前面的标题:【1. API 格式及说明】中的第二行
plot([x], y, [fmt], [x2], y2, [fmt2], ..., **kwargs)import matplotlib.pyplot as plt
x = [1, 2, 3, 4, 5]
y = [6, 2, 2, 1, 3]
x1 = [1, 2, 3]
y1 = [4, 5, 1]
plt.plot(x, y, 'r^-', x1, y1, 'g.-')
plt.show()