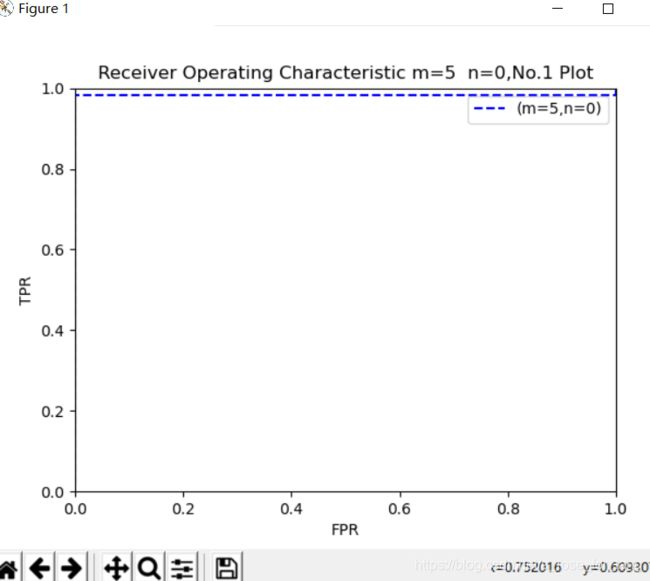
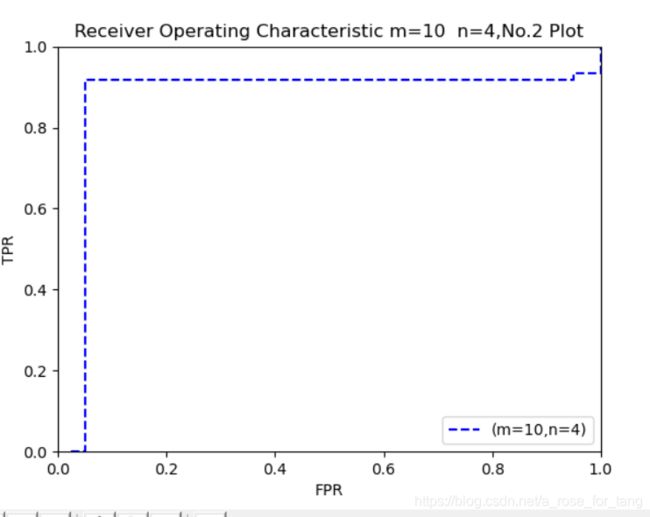
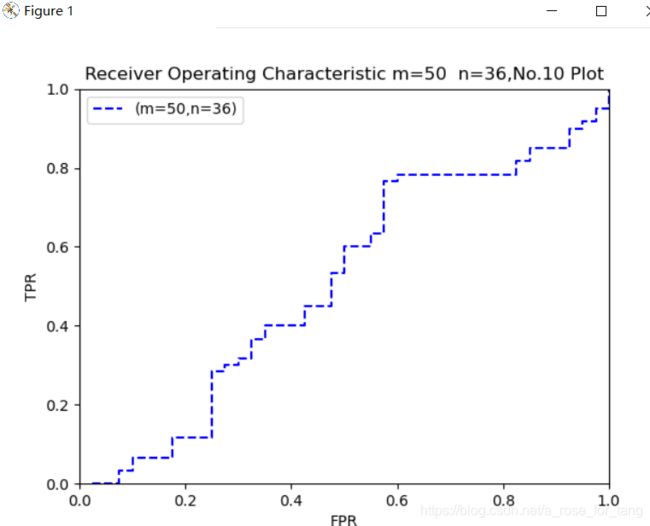
ROC曲线Receiver Operating Characteristic的简单python实现
ROC曲线:x轴FPR,y轴TPR
1.背景:是机器学习的课堂作业
2.思路参考地址
参考地址:参考地址
3.实现
3.1生成100个label
首先import
import numpy as np
import matplotlib.pyplot as plt
def create_data(length):
    length=int(length)
    data = np.ones(length)
    #plus int ,cause may make float number
    data_60 = data[0:int(length*.6)]
    data_40 = data[int(length*.6):] * -1
    label= np.copy(np.append(data_60, data_40))
    return label
3.2 生成100个score
def create_score(label,length):
    score=np.copy(label)
    score[0:int((length) *.6)] =score[0:int((length) *.6)] *0.7
    score[int((length) *.6):] = score[int((length) *.6):] * (-.3)
    return score
3.3 随机数挑选
def select_mn(length,m,n):
    #https://www.e-learn.cn/topic/3362768随机数挑选
    # 索引范围为[0, n),随机选x个不重复,注意replace=False才是不重复,replace=True则有可能重复
    index1 =np.random.choice(np.arange(int(length*.6)),size=m,replace=False)
    index2 = np.random.choice((np.arange(int(length)))[int(length*.6):], size=n, replace=False)
    return index1,index2
3.4 改变 +画图函数
def plot_roc(m,n,length):
    time=int(m/5)
    # 定义100个数
    length = length
    # 在前60个数里面挑选m个数改变,后四十个数里面挑选n个数进行改变
    m = m
    n = n
    # 创建label数组
    label = create_data(length)
    print('label:', (label))
    # 创建score数组
    score = create_score(label, length)
    print('score:', score)
    # 随机在里面挑选m ,n个数
    index1, index2 = select_mn(length, m, n)
    # print(index1,index2)
    new_score = np.copy(score)
    # 开始改变score的数字
    for element in index1:
        new_score[element] = np.random.rand()
    for element in index2:
        new_score[element] = np.random.rand()
    print('new_score after add m and n in score : ', new_score)
    # 对该数组进行从大到小的排序,以方便进行统计
    new_score_copy = np.copy(np.sort(new_score, kind='quicksort'))
    new_score_copy = new_score_copy[::-1]
    print('new_score after sort : ', new_score_copy)
    '''print('new_score:',new_score)
    #从小到大排序
    new_score_sort =np.sort(new_score)
    #反转	a = a[::-1]从大到小
    new_score_sort=new_score_sort[::-1]
    print(new_score_sort)'''
    x = []
    y = []
    # 开始统计fpr ,tpr
    for threshold in new_score_copy[:]:
        tpr = 0
        fpr = 0
        for element in new_score[:int(length * .6)]:
            if element >= threshold:
                tpr = tpr + 1
        for element in new_score[int(length * .6):]:
            if element >= threshold:
                fpr = fpr + 1
        x.append(float(fpr / 40))
        y.append(float(tpr / 60))
    print('x : is ', x)
    print('y : is ', y)
    label = '(m=' + str(m) + ',n=' + str(n) + ')'
    plt.plot(x, y, 'b--', label=label)
    title = "Receiver Operating Characteristic " + 'm=' + str(m) + '  ' + 'n=' + str(n) +",No."+str(time)+' Plot'
    plt.title(title)
    plt.xlim((0, 1))
    plt.ylim((0, 1))
    plt.xlabel("FPR")
    plt.ylabel("TPR")
    plt.legend()
    plt.show()
    return x,y
3.5 画10个图
if __name__ == '__main__':
    for i in range(10):
        i1=(i+1)*5
        i2=(i)*4
        x, y = plot_roc(m=i1, n=i2, length=100)
    #x, y = plot_roc(m=45, n=23, length=100)
4.结论
当m与n 变大的时候
使得分类器变得不准了
曲线下面的面积将会变小。
就酱紫。。


