MeanShift算法原理及其python自定义实现
MeanShift算法原理及其python自定义实现
- MeanShift算法原理
- MeanShift python实现
-
- 实现思路:
- 代码:
- 运行结果:
MeanShift算法原理
Meanshift是聚类中的一种经典方法,思想简单,用途广泛
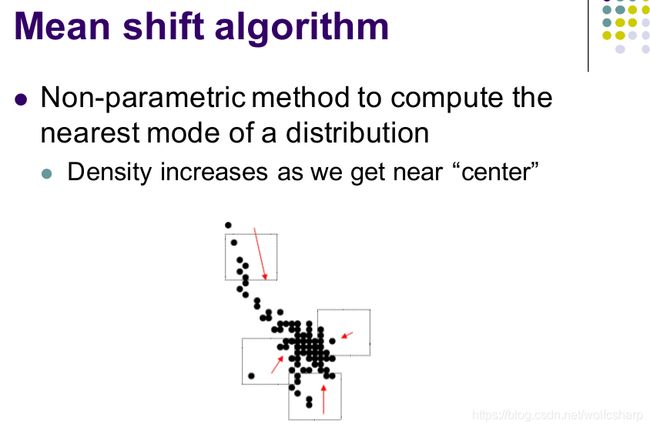
 Meanshift基于这样的事实,一个类的中心处 点的空间密度 是最大的,因此给定一个点,只要沿着密度方向,由稀疏指向稠密就可以找到这个点所在类的中心点。
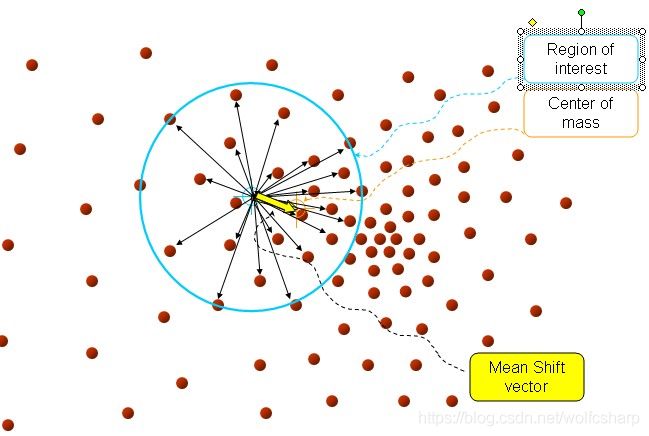
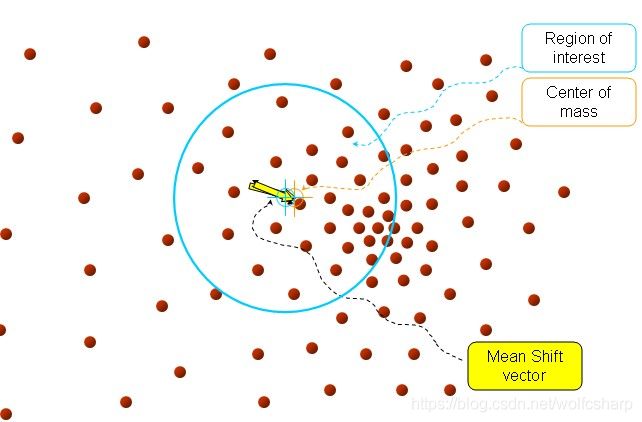
Meanshift的核心思想是: 给定一个数据点,在其周围一定的Region of interest内,计算这个Region的质心,由原来的点指向这个计算出来的质心的向量被称为Mean Shift vector,如下图中黄色向量表示的那样。
 接下来,将原来Region中心点的坐标置为质心的坐标(这个坐标是计算出来的,并不一定恰好落在原来的数据点上),在以质心坐标为中心的Region中继续计算新的质心
 直到Mean Shift vector的大小小于设定阈值的时候停止迭代

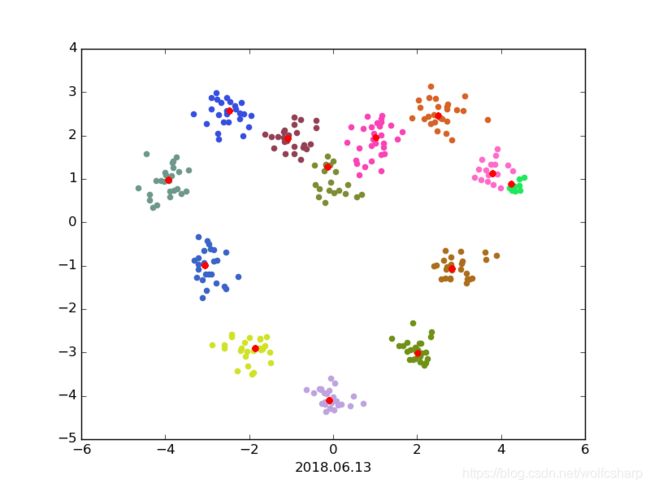
每一轮迭代中都对每一个点进行上面的操作,等到所有的点都收敛于有限的几个中心时,算法结束。
该算法具有很快的收敛速度。
数学推导参考:http://www.cnblogs.com/liqizhou/archive/2012/05/12/2497220.html
代码实现还可参考:https://blog.csdn.net/jinshengtao/article/details/30258833
MeanShift python实现
实现思路:
- 构建距离度量函数
- 构建Gaussian概率密度函数,以实现局部Region操作
- 构建MeanShift类
(1) 点移动函数:对输入的一个点,计算在其Gaussian局部范围的点的影响下质心移动的新位置
(2) 聚类号分配函数:对所有点移动后的结果进行归类
(3) 入口函数:一些循环控制等
Tips:显然每个点的第一次移动对这个点的类的确定是至关重要的,尤其是那些在类边缘处类别定义比较模糊的位置的点。因为马太效应,在以后的移动中,这个点被质心吸引的力会更大
代码:
'''
#Implement mean-shift algorithm only using basic python
#Author:Leo Ma
#For csmath2019 assignment3,ZheJiang University
#Date:2019.04.23
'''
import numpy as np
import random
DISTANCE_THRESHOLD = 1e-4
CLUSTER_THRESHOLD = 1e-1

#define distance metric
def distance(a,b):
    return np.linalg.norm(np.array(a)-np.array(b))


#distance=(x-u)**2
def Gaussian_kernal(distance,sigma):
    return (1/(sigma*np.sqrt(2*np.pi)))*np.exp(-0.5*distance/(sigma**2))


#MeanShift类
class MeanShift(object):
    def __init__(self,kernal = Gaussian_kernal):
        self.kernal = kernal

    ##计算center_point点移动后的坐标
    def shift_points(self,center_point,whole_points,Gaussian_sigma):
        shifting_px = 0.0
        shifting_py = 0.0
        sum_weight = 0.0
        for each_point in whole_points:#遍历每一个点
            dis = distance(center_point,each_point)#计算当前点与中心点的距离
            Gaussian_weight = self.kernal(dis,Gaussian_sigma)#计算当前点距离中心点的高斯权重
            #所有向量相加
            shifting_px += Gaussian_weight * each_point[0]
            shifting_py += Gaussian_weight * each_point[1]
            sum_weight += Gaussian_weight
        #归一化
        shifting_px /= sum_weight
        shifting_py /= sum_weight
        return [shifting_px,shifting_py]

    #根据shift之后的点坐标shifting_points获得聚类id
    def cluster_points(self,shifting_points):
        clusterID_points = []#用于存放每一个点的类别号
        cluster_id=0#聚类号初始化为0
        cluster_centers = []#聚类中心点
        for i,each_point in enumerate(shifting_points):#遍历处理每一个点
            if i==0:#如果是处理的第一个点
                clusterID_points.append(cluster_id)#将这个点归为初始化的聚类号(0)
                cluster_centers.append(each_point)#将这个点看作聚类中心点
                cluster_id+=1#聚类号加1
            else:#处理的不是第一个点的情况
                for each_center in cluster_centers:#遍历每一个聚类中心点
                    dis = distance(each_center,each_point)#计算当前点与该聚类中心点的距离
                    if dis < CLUSTER_THRESHOLD:#如果距离小于聚类阈值
                        clusterID_points.append(cluster_centers.index(each_center))#就将当前处理的点归为当前中心点同类(聚类号赋值)
                if(len(clusterID_points) DISTANCE_THRESHOLD
                #本轮迭代中最大的距离存储到distance_max中
                distance_max = max(distance_max,dis)
            #如果在一轮迭代中,所有点移动的最大距离都小于停止阈值,就停止迭代
            if(distance_max < DISTANCE_THRESHOLD):
                break
        #根据shift之后的点坐标shift_points获得聚类id
        cluster_class_id = self.cluster_points(shifting_points.tolist())
        return shifting_points,cluster_class_id

from sklearn.datasets.samples_generator import make_blobs
import matplotlib.pyplot as plt


#按照均匀分布随机产生n个颜色,每个颜色都由R、G、B三个分量表示
def colors(n):
  ret = []
  for i in range(n):
    ret.append((random.uniform(0, 1), random.uniform(0, 1), random.uniform(0, 1)))
  return ret

def main():
    centers = [[0, 1], [-1, 2], [1, 2], [-2.5, 2.5], [2.5,2.5], [-4,1], [4,1], [-3,-1], [3,-1], [-2,-3], [2,-3], [0,-4]]#设置一些中心点
    X, _ = make_blobs(n_samples=300, centers=centers, cluster_std=0.3)#产生以这些中心点为中心,一定标准差的n个samples

    mean_shifter = MeanShift()
    shifted_points, mean_shift_result = mean_shifter.fit(X, Gaussian_sigma=0.3)#Gaussian核设置为0.5,对X进行mean_shift

    np.set_printoptions(precision=3)
    print('input: {}'.format(X))
    print('assined clusters: {}'.format(mean_shift_result))
    color = colors(np.unique(mean_shift_result).size)

    for i in range(len(mean_shift_result)):
        plt.scatter(X[i, 0], X[i, 1], color = color[mean_shift_result[i]])
        plt.scatter(shifted_points[i,0],shifted_points[i,1], color = 'r')
    plt.xlabel("2018.06.13")
    plt.savefig("result_meanshift.png")
    plt.show()

if __name__ == '__main__':
    main()
