python+OpenCv笔记(十五):边缘检测——Canny边缘检测
Canny边缘检测
- Canny边缘检测算法是一种非常流行的边缘检测算法,是John F.Canny 于1986年提出的,目前被业界公认为最优的边缘检测算法。
- 原理:
python+OpenCv笔记(十六):边缘检测原理(Sobel算子原理、Laplacian算子原理、Canny边缘检测原理) https://blog.csdn.net/qq_45832961/article/details/122398810
 - OpenCv API:
dst = cv2.Canny(image, threshold1, threshold2)
参数:
- image:输入的灰度图
- threshold1:minVal,较小的阈值将间断的边缘连接起来。
- threshold2:maxVal,较大的阈值检测图像中明显的边缘。
代码编写
import cv2 as cv
import matplotlib.pyplot as plt
import numpy as np

src = cv.imread("E:\\qi.png", 0)  # 直接以灰度图方式读入
img = src.copy()

# Canny边缘检测
threshold1 = 0
threshold2 = 160
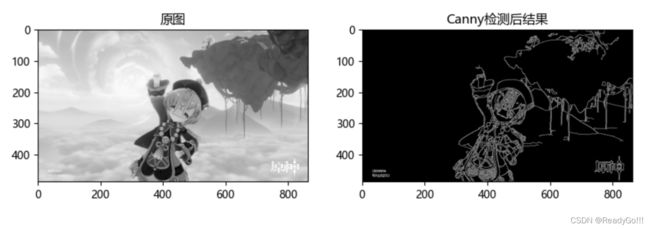
img_Canny = cv.Canny(img, threshold1, threshold2)

# 显示图像
fig, axes = plt.subplots(nrows=1, ncols=2, figsize=(10, 8), dpi=100)
axes[0].imshow(img, cmap=plt.cm.gray)
axes[0].set_title("原图")
axes[1].imshow(img_Canny, cmap=plt.cm.gray)
axes[1].set_title("Canny检测后结果")
plt.show()
