Graphviz之DT:手把手教你使用可视化工具Graphviz将dot文件转为结构图的pdf文件
Graphviz之DT:手把手教你使用可视化工具Graphviz将dot文件转为结构图的pdf文件
目录
Graphviz软件的下载
Graphviz将dot文件转为结构图的pdf文件
输出结果
Graphviz软件的下载
Graphviz:可视化工具Graphviz的简介、安装、使用方法、经典案例之详细攻略
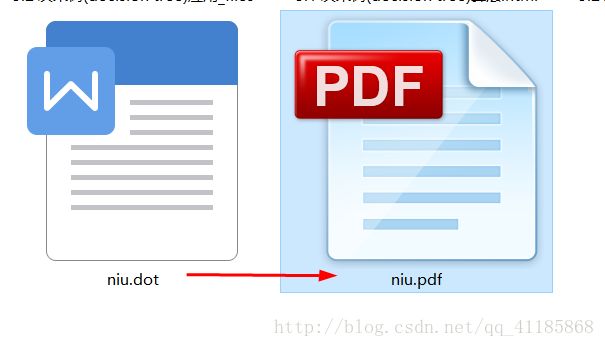
Graphviz将dot文件转为结构图的pdf文件
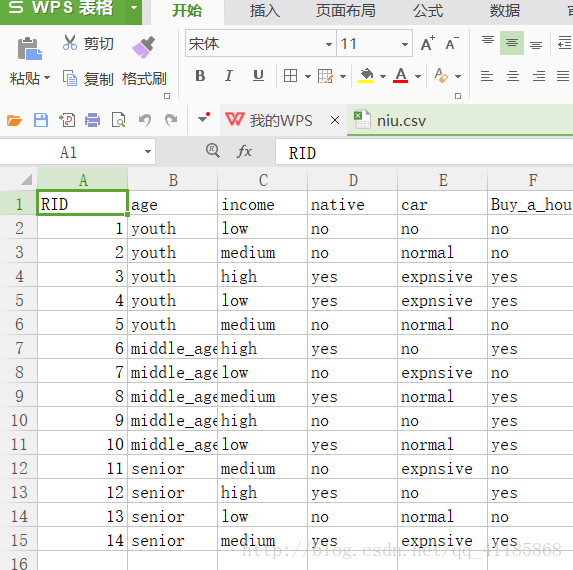
cmd,在dos环境下,dot-Tpdf input.dot -o convertoutput.pdf命令,即可将niu.dot转为niu.pdf。我的dot文件是下边这个模样
-
digraph
Tree {
-
node [
shape=box]
;
-
0 [
label="native=no
<=
0.5
\nentropy
=
0.985
\nsamples
=
14
\nvalue
= [
6,
8]
"] ;
-
1 [label="
entropy
=
0.0
\nsamples
=
7
\nvalue
= [
0,
7]
"] ;
-
0 -> 1 [labeldistance=2.5, labelangle=45, headlabel="
True
"] ;
-
2 [label="
income=high
<=
0.5
\nentropy
=
0.592
\nsamples
=
7
\nvalue
= [
6,
1]
"] ;
-
0 -> 2 [labeldistance=2.5, labelangle=-45, headlabel="
False
"] ;
-
3 [label="
entropy
=
0.0
\nsamples
=
6
\nvalue
= [
6,
0]
"] ;
-
2 -> 3 ;
-
4 [label="
entropy
=
0.0
\nsamples
=
1
\nvalue
= [
0,
1]
"] ;
-
2 -> 4 ;
-
}
-
-
digraph
Tree {
-
node [
shape=box]
;
-
0 [
label="native=no
<=
0.5
\nentropy
=
0.985
\nsamples
=
14
\nvalue
= [
6,
8]
"] ;
-
1 [label="
entropy
=
0.0
\nsamples
=
7
\nvalue
= [
0,
7]
"] ;
-
0 -> 1 [labeldistance=2.5, labelangle=45, headlabel="
True
"] ;
-
2 [label="
income=high
<=
0.5
\nentropy
=
0.592
\nsamples
=
7
\nvalue
= [
6,
1]
"] ;
-
0 -> 2 [labeldistance=2.5, labelangle=-45, headlabel="
False
"] ;
-
3 [label="
entropy
=
0.0
\nsamples
=
6
\nvalue
= [
6,
0]
"] ;
-
2 -> 3 ;
-
4 [label="
entropy
=
0.0
\nsamples
=
1
\nvalue
= [
0,
1]
"] ;
-
2 -> 4 ;
-
}
-
输出结果
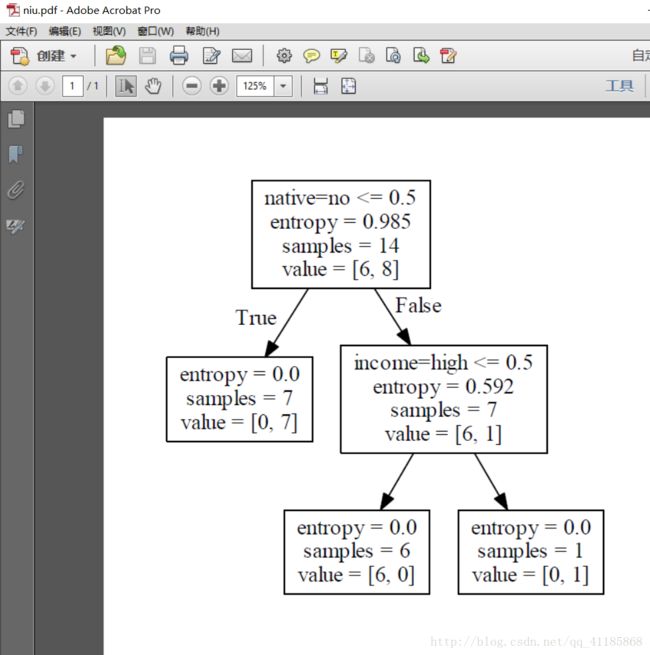
大功告成啦,哈哈