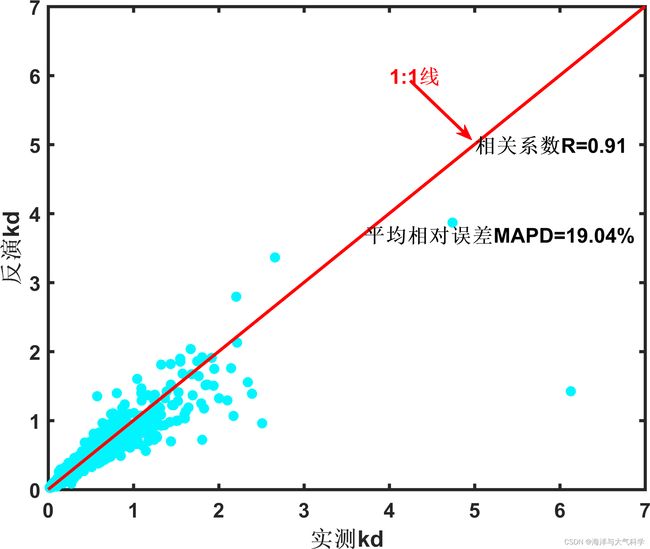
matlab画标准散点图,1:1线条,计算相关系数,平均相对误差
matlab画标准散点图,1:1线条,计算相关系数,平均相对误差


代码如下:
%% 作业1:利用matlab制作标准散点图:1:1线条,计算相关系数,平均相对误差
%% 微信公众号:海洋与大气科学
%% 作者:mapm
%% 时间:2022年12月1号
%% 如需测试数据,请加QQ:916490285
% 任务一:读取数据:kd.xlsx中的两列数据;
% 横轴为:实测kd;纵轴为:反演kd;
clear;clc;close all;
[data1,data2,data3]=xlsread('kd.xlsx');
sc_kd=data1(:,1);%实测kd
fy_kd=data1(:,2);%反演kd
% 画图
figure
scatter(sc_kd,fy_kd,'o','SizeData',36,'MarkerEdgeColor', [0 245 255]./255,'MarkerFaceColor',[0 245 255]./255)
xlabel('实测kd','fontsize',13,'fontweight','bold','fontname','宋体')
ylabel('反演kd','fontsize',13,'fontweight','bold','fontname','宋体')
set(gcf,'color','w','position',[500 200 650 500])
set(gca,'linewidth',2,'fontsize',13,'fontweight','bold','fontname','time news roman')
box on
% axis equal
axis([0 7 0 7])
export_fig('原始散点图.png','-r300')
%% 任务二:
% 添加1:1线条
figure
set(gcf,'color','w','position',[500 200 650 500])
scatter(sc_kd,fy_kd,'o','SizeData',36,'MarkerEdgeColor', [0 245 255]./255,'MarkerFaceColor',[0 245 255]./255)
xlabel('实测kd','fontsize',13,'fontweight','bold','fontname','宋体')
ylabel('反演kd','fontsize',13,'fontweight','bold','fontname','宋体')
set(gca,'linewidth',2,'fontsize',13,'fontweight','bold','fontname','time news roman')
hold on
line([0 7],[0 7],'linewidth',2,'color','r')% 1:1线
annotation('arrow',[0.6 0.68],[0.8 0.7],'color','r','linewidth',2)
text(4,6,'1:1线','fontsize',13,'fontweight','bold','fontname','time news roman','color','r')
axis([0 7 0 7])
box on
export_fig('原始散点图_1比1线.png','-r300')
%% 任务三:
% 计算平均相对误差:MAPD
n=length(sc_kd);
a=0;%用于累加
for i=1:n
    a1=1/n*abs(sc_kd(i)-fy_kd(i))*100/sc_kd(i);
    a=a+a1;
end
MAPD=a;%平均相对误差
% 计算相关系数R
R1=corrcoef(sc_kd,fy_kd);
R=R1(1,2);
%% 最后一步:把计算的 MAPD和R放进图片
% 画图
figure
set(gcf,'color','w','position',[500 200 650 500])
scatter(sc_kd,fy_kd,'o','SizeData',36,'MarkerEdgeColor', [0 245 255]./255,'MarkerFaceColor',[0 245 255]./255)
xlabel('实测kd','fontsize',13,'fontweight','bold','fontname','宋体')
ylabel('反演kd','fontsize',13,'fontweight','bold','fontname','宋体')
set(gca,'linewidth',2,'fontsize',13,'fontweight','bold','fontname','time news roman')
hold on
line([0 7],[0 7],'linewidth',2,'color','r')% 1:1线
annotation('arrow',[0.6 0.68],[0.8 0.7],'color','r','linewidth',2)
text(4,6,'1:1线','fontsize',13,'fontweight','bold','fontname','time news roman','color','r')
text(3.7,3.7,['平均相对误差MAPD=',num2str(round(MAPD,2)),'%'],'fontsize',13,'fontweight','bold','fontname','time news roman')
text(5,5,['相关系数R=',num2str(round(R,2))],'fontsize',13,'fontweight','bold','fontname','time news roman')
axis([0 7 0 7])
box on
export_fig('原始散点图_1比1线_MAPD_R.png','-r300')