jupyter lab中不能显示matplotlib动画动态图,并且报错Javascript Error: IPython is not defined的解决办法
matplotlib在jupyterlab中显示问题的一些尝试
-
- 问题
- 在jupyter notebook中显示的情况
- 在jupyter lab中显示情况
- PS:如果修改了%matplotlib xxx之后运行出现提示并报错:
- 为什么会这样
- 总结
问题
最近在折腾jupyter lab里用matplotlib画图,但是遇到了显示的问题。同样的代码在jupyter notebook中可以正常显示,但是在jupyter lab中就报错。几番搜索,终于解决。
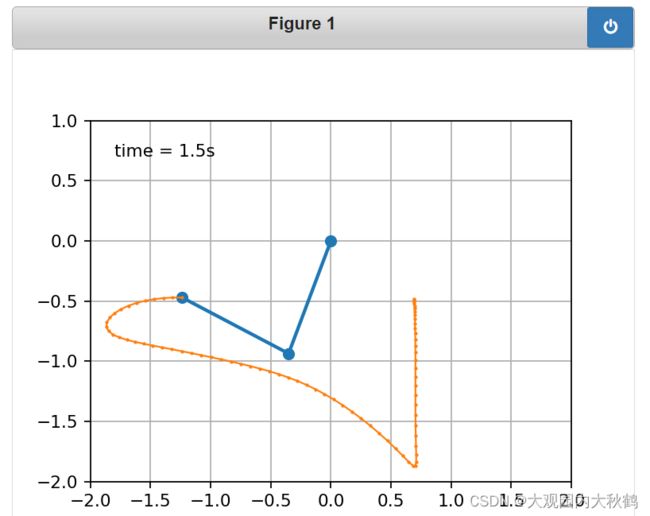
下面以matplotlib官方案例双摆问题为例。这里输出的结果应该是一个动态图像,我们希望它在jupyter notebook或者jupyter lab中均能正常显示动态图。
matplotlib给出的双摆动画图像的代码是这样的:
from numpy import sin, cos
import numpy as np
import matplotlib.pyplot as plt
import scipy.integrate as integrate
import matplotlib.animation as animation
from collections import deque

G = 9.8  # acceleration due to gravity, in m/s^2
L1 = 1.0  # length of pendulum 1 in m
L2 = 1.0  # length of pendulum 2 in m
L = L1 + L2  # maximal length of the combined pendulum
M1 = 1.0  # mass of pendulum 1 in kg
M2 = 1.0  # mass of pendulum 2 in kg
t_stop = 5  # how many seconds to simulate
history_len = 500  # how many trajectory points to display


def derivs(state, t):

    dydx = np.zeros_like(state)
    dydx[0] = state[1]

    delta = state[2] - state[0]
    den1 = (M1+M2) * L1 - M2 * L1 * cos(delta) * cos(delta)
    dydx[1] = ((M2 * L1 * state[1] * state[1] * sin(delta) * cos(delta)
                + M2 * G * sin(state[2]) * cos(delta)
                + M2 * L2 * state[3] * state[3] * sin(delta)
                - (M1+M2) * G * sin(state[0]))
               / den1)

    dydx[2] = state[3]

    den2 = (L2/L1) * den1
    dydx[3] = ((- M2 * L2 * state[3] * state[3] * sin(delta) * cos(delta)
                + (M1+M2) * G * sin(state[0]) * cos(delta)
                - (M1+M2) * L1 * state[1] * state[1] * sin(delta)
                - (M1+M2) * G * sin(state[2]))
               / den2)

    return dydx

# create a time array from 0..t_stop sampled at 0.02 second steps
dt = 0.02
t = np.arange(0, t_stop, dt)

# th1 and th2 are the initial angles (degrees)
# w10 and w20 are the initial angular velocities (degrees per second)
th1 = 120.0
w1 = 0.0
th2 = -10.0
w2 = 0.0

# initial state
state = np.radians([th1, w1, th2, w2])

# integrate your ODE using scipy.integrate.
y = integrate.odeint(derivs, state, t)

x1 = L1*sin(y[:, 0])
y1 = -L1*cos(y[:, 0])

x2 = L2*sin(y[:, 2]) + x1
y2 = -L2*cos(y[:, 2]) + y1

fig = plt.figure(figsize=(5, 4))
ax = fig.add_subplot(autoscale_on=False, xlim=(-L, L), ylim=(-L, 1.))
ax.set_aspect('equal')
ax.grid()

line, = ax.plot([], [], 'o-', lw=2)
trace, = ax.plot([], [], '.-', lw=1, ms=2)
time_template = 'time = %.1fs'
time_text = ax.text(0.05, 0.9, '', transform=ax.transAxes)
history_x, history_y = deque(maxlen=history_len), deque(maxlen=history_len)


def animate(i):
    thisx = [0, x1[i], x2[i]]
    thisy = [0, y1[i], y2[i]]

    if i == 0:
        history_x.clear()
        history_y.clear()

    history_x.appendleft(thisx[2])
    history_y.appendleft(thisy[2])

    line.set_data(thisx, thisy)
    trace.set_data(history_x, history_y)
    time_text.set_text(time_template % (i*dt))
    return line, trace, time_text


ani = animation.FuncAnimation(
    fig, animate, len(y), interval=dt*1000, blit=True)
plt.show()
在jupyter notebook中显示的情况
- 不使用任何魔法函数 → 只显示第一帧图像。
- 添加%matplotlib inline → 只显示第一帧图像。
- 添加%matplotlib notebook → 正常显示动态图像和交互界面。
%matplotlib notebook #添加魔法函数
from numpy import sin, cos
import numpy as np
import matplotlib.pyplot as plt
import scipy.integrate as integrate
import matplotlib.animation as animation
from collections import deque
在jupyter lab中显示情况
- 不添加任何魔法函数 → 仅可以显示第一帧动画:
- 添加魔法函数 %matplotlib inline → 显示第一帧动画,并弹出警告:
UserWarning: Animation was deleted without rendering anything. This is most likely not intended. To prevent deletion, assign the Animation to a variable, e.g. `anim`, that exists until you have outputted the Animation using `plt.show()` or `anim.save()`.
- 使用魔法函数%matplotlib notebook → 报错
Javascript Error: IPython is not defined
- 安装了ipympl并使用%matplotlib widget → 正常显示动画
conda prompt中安装ipympl:conda install ipympl
%matplotlib widget #添加魔法函数
from numpy import sin, cos
import numpy as np
import matplotlib.pyplot as plt
import scipy.integrate as integrate
import matplotlib.animation as animation
from collections import deque
PS:如果修改了%matplotlib xxx之后运行出现提示并报错:
Warning: Cannot change to a different GUI toolkit: widget. Using notebook instead.
Javascript Error: IPython is not defined
这是导入顺序问题,因为在修改%matplotlib xxx之前我们可能已经定义过一次matplotlib的backend了。所以重新指定就会报错。解决办法也很简单,重启内核之后再运行即可。
比如在文档中本来有%matplotlib notebook → 运行单元格(此时GUI工具已经被指定) → 但因为lab不支持所以报错 → 改为%matplotlib widget → 提示不能切换GUI工具 → 重启内核 → 重新运行单元格、解决。
为什么会这样
以下是我的一些想法,不一定准确。
对于图形的显示和交互(Interactive figures),matplotlib文档是这样说的:
Matplotlib ships with backends binding to several GUI toolkits (Qt, Tk, Wx, GTK, macOS, JavaScript) and third party packages provide bindings to kivy and Jupyter Lab. For the figures to be responsive to mouse, keyboard, and paint events, the GUI event loop needs to be integrated with an interactive prompt. We recommend using IPython (see below).
简单点说就是,matplotlib提供了一些后端(backends)来实现不同绘图的显示和交互(比如放大缩小,拖拽大小等)方式,比如在弹出的新窗口里显示绘图就是其中一种显示方式。
但是在jupyter中,我们在浏览器的页面里编写程序,并且希望图像能够嵌入在页面中,而不是弹出窗口。为了实现这个效果,matplotlib提供了一些backends工具,使用办法是在导入matplotlib模块前用加一行魔法函数%matplotlib [要指定的backends]。我们可以通过一行代码查看所有可用的backends:
%matplotlib -l #查看所有可用的backends
Available matplotlib backends: ['tk', 'gtk', 'gtk3', 'gtk4', 'wx', 'qt4', 'qt5', 'qt6', 'qt', 'osx', 'nbagg', 'notebook', 'agg', 'svg', 'pdf', 'ps', 'inline', 'ipympl', 'widget']
下面介绍几个backends:
- %matplotlib inline,matplotlib文档是这样说的:
To get the interactive functionality described here, you must be using an interactive backend. The default backend in notebooks, the inline backend, is not. backend_inline renders the figure once and inserts a static image into the notebook when the cell is executed. Because the images are static, they can not be panned / zoomed, take user input, or be updated from other cells.
如果要获得这里描述的交互功能,必须使用交互式后端,而不是notebook中的默认后端(inline backend)。Backend_inline仅渲染一次,并在执行单元格时将静态图像插入到notebook中。由于图像是静态的,它们不能被平移/缩放、接受用户输入或从其他单元格更新。
也就是说,无论是在notebook还是lab,不添加任何魔法函数的时候,默认的后端就是’inline’。它显示的是静态的图像,输出的就是一张普通的图片,不包括交互界面,拖拽、放大缩小工具,就像嵌入网页一样。这样的图像比较有利于分享,把ipytnb文件分享给别人,别人不需要运行单元格也能直接看到输出的结果。
- %matplotlib notebook,matplotlib文档这样说:
If you only need to use the classic notebook, you can use
%matplotlib notebook
which uses the backend_nbagg backend provided by Matplotlib; however, nbagg does not work in Jupyter Lab.
如果你使用的是传统的notebook,你可以使用%matplotlib notebook,它使用Matplotlib提供的backend_nbagg后端;然而,nbagg在jupyter lab中不起作用。
也就是说如果了添加%matplotlib notebook,则默认指定使用nbagg后端,它可以在notebook内提供一个交互式的图像显示界面,而非静态,所以就动态图也可以直接显示。但是用此方法显示动态图然后分享给别人的时候,可能别人就不一定能看到动画了,得重新连接到ipython内核并运行程序才能看到。
但是这个nbagg后端只能在jupyter notebook里使用,而在jupyter lab中并不起作用。所以在jupyter lab中运行这一行魔法函数就会报错:“Javascript Error: IPython is not defined”,如上面例子。
- 那如果要在jupyter lab显示动画怎么办?根据matplotlib的文档:
To get interactive figures in the ‘classic’ notebook or Jupyter lab, use the ipympl backend (must be installed separately) which uses the ipywidget framework. If ipympl is installed use the magic: %matplotlib widget to select and enable it.
要在“传统的”笔记本或Jupyter lab中获得交互式图形,请使用ipympl后端(必须单独安装),它使用的是ipywidget框架。如果已经安装了ipympl,使用魔法函数:%matplotlib widget去选定它。
也就是说,如果要在jupyter lab中以交互式显示图像,就要单独安装ipympl(如上面例子),然后在程序开头添加魔法函数%matplotlib widget,从而使用widget后端,而不是%matplotlib notebook指定的nbagg后端。
总结
- 如果只是绘制静态图像,那么可以不添加魔法函数,或者添加%matplotlib inline。
- 如果想要看到动态图,则在jupyter notebook使用%matplotlib notebook;在jupyter lab中使用%matplotlib widget(还要提前安装ipympl)
- 如果报错切换GUI 工具失败( Cannot change to a different GUI toolkit),就重启ipython内核。

