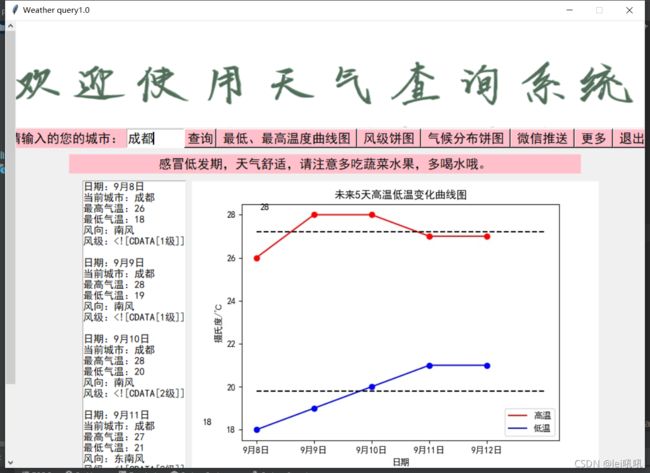
python实现天气数据爬取实现数据可视化和天气查询gui界面设计
在学校大一实训中,我的实训项目就是使用python爬取天气数据并且实现gui图形界面的设计。
实训结束了,希望自己的代码可以帮助大家的学习。(代码是大一时候写的,比较青涩,大家多包涵)
第一个部分是getdata的部分,就是爬取数据,并将数据存放在csv文件中
(爬取数据为指定城市5天的天气情况,包括:日期,天气,最高温度,最低温度,风向,风级,当天天气小贴士)
# Author:吼吼
# -*- codeing=utf-8 -*-
# @Time :2021/8/21 10:24
# @File: getdata.py
# @Software:PyCharm

# -*- coding: utf-8 -*-

import urllib.request
import csv
import json
import gzip  # 解压、压缩的模块

cityname = input("请输入:")
# 访问的url,其中urllib.parse.quote是将城市名转换为url的组件
url = 'http://wthrcdn.etouch.cn/weather_mini?city=' + urllib.parse.quote(cityname)
print(urllib.parse.quote(cityname))
# 发出请求并读取到weather_data
weather_data = urllib.request.urlopen(url).read()
# 以utf-8的编码方式解压数据
weather_data = gzip.decompress(weather_data).decode('utf-8')
# 将json数据转化为dict数据
weather_dict = json.loads(weather_data)
print(weather_dict)
if weather_dict.get('desc') == 'invilad-citykey':
    print("输入的城市名有误")
elif weather_dict.get('desc') == 'OK':
    forecast = weather_dict.get('data').get('forecast')

    day1 = [weather_dict.get('data').get('city'), forecast[0].get('date'), forecast[0].get('type')]
    high = (str(forecast[0].get('high'))).replace("℃", '')
    day1.append(high.replace("高温 ", ""))
    low = (str(forecast[0].get('low'))).replace("℃", '')
    day1.append(low.replace("低温 ", ""))
    day1.append(forecast[0].get('fengxiang'))
    day1.append(forecast[0].get('fengli'))
    day1.append(weather_dict.get('data').get('ganmao'))
    wendu = weather_dict.get('data').get('wendu')
    day1.append(wendu)
    print(day1)

    day2 = [weather_dict.get('data').get('city'), forecast[1].get('date'), forecast[1].get('type')]
    high = (str(forecast[1].get('high'))).replace("℃", '')
    day2.append(high.replace("高温 ", ""))
    low = (str(forecast[1].get('low'))).replace("℃", '')
    day2.append(low.replace("低温 ", ""))
    day2.append(forecast[1].get('fengxiang'))
    day2.append(forecast[1].get('fengli'))
    print(day2)

    day3 = [weather_dict.get('data').get('city'), forecast[2].get('date'), forecast[2].get('type')]
    high = (str(forecast[2].get('high'))).replace("℃", '')
    day3.append(high.replace("高温 ", ""))
    low = (str(forecast[2].get('low'))).replace("℃", '')
    day3.append(low.replace("低温 ", ""))
    day3.append(forecast[2].get('fengxiang'))
    day3.append(forecast[2].get('fengli'))
    print(day3)

    day4 = [weather_dict.get('data').get('city'), forecast[3].get('date'), forecast[3].get('type')]
    high = (str(forecast[3].get('high'))).replace("℃", '')
    day4.append(high.replace("高温 ", ""))
    low = (str(forecast[3].get('low'))).replace("℃", '')
    day4.append(low.replace("低温 ", ""))
    day4.append(forecast[3].get('fengxiang'))
    day4.append(forecast[3].get('fengli'))
    print(day4)

    day5 = [weather_dict.get('data').get('city'), forecast[4].get('date'), forecast[4].get('type')]
    high = (str(forecast[4].get('high'))).replace("℃", '')
    day5.append(high.replace("高温 ", ""))
    low = (str(forecast[4].get('low'))).replace("℃", '')
    day5.append(low.replace("低温 ", ""))
    day5.append(forecast[4].get('fengxiang'))
    day5.append(forecast[4].get('fengli'))
    print(day5)


def write_to_csv(file_name, data1, data2, data3, data4, data5):
    """保存为csv文件"""
    with open(file_name, 'a', encoding="utf-8", newline="", errors='ignore') as f:
        header = ['城市', '日期', '天气', '最高气温', '最低气温', '风向', '风级', '感冒小贴士', '现在温度']
        f_csv = csv.writer(f)
        f_csv.writerow(header)
        f_csv.writerow(data1)
        f_csv.writerow(data2)
        f_csv.writerow(data3)
        f_csv.writerow(data4)
        f_csv.writerow(data5)
    f.close()


write_to_csv("weather_data1.csv", day1, day2, day3, day4, day5)
csv = "weather_data1.csv"
运行getdata.py文件
得到数据
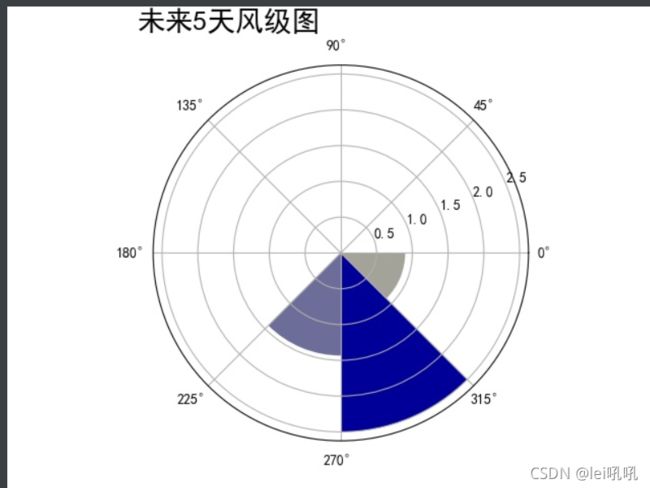
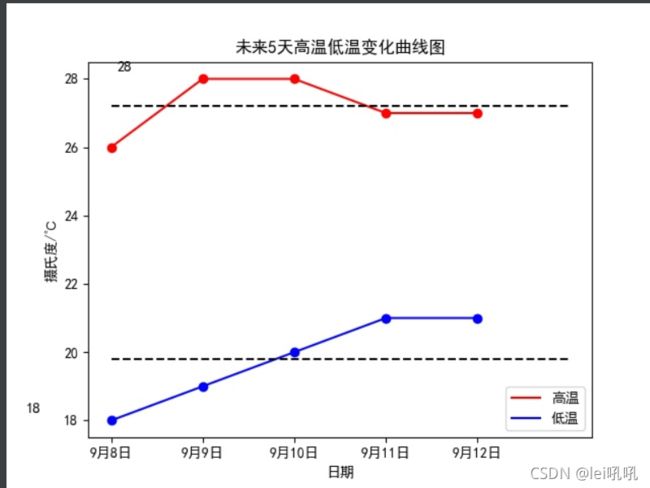
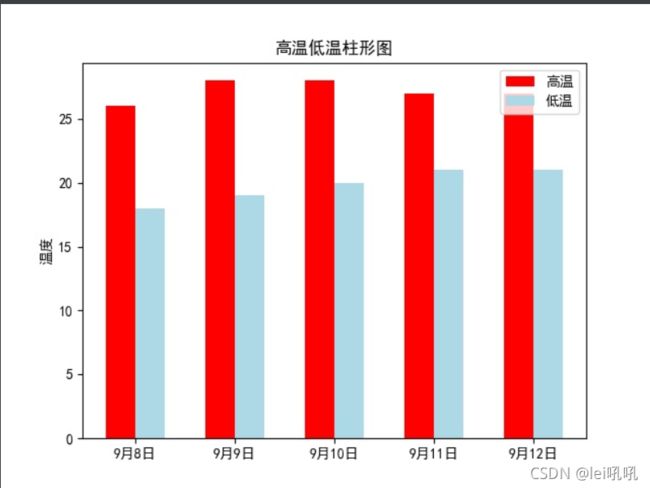
第二的部分就是数据可视化的部分(将爬取到的数据进行可视化操作,绘制“未来5天气候分布饼图”,“未来5天风级图”,“未来5天高温低温变化曲线图”和“未来5天高温低温变化柱形图”
# Author:吼吼
# -*- codeing=utf-8 -*-
# @Time :2021/8/21 10:24
# @File: dataAnalysis.py
# @Software:PyCharm

import matplotlib.pyplot as plt
import numpy as np
import pandas as pd
from datetime import timedelta, datetime

times = []


def tem1(data):  # 未来5天高温低温变化柱形图绘制
    # 这两行代码解决 plt 中文显示的问题
    plt.rcParams['font.sans-serif'] = ['SimHei']
    plt.rcParams['axes.unicode_minus'] = False

    # 输入统计数据
    tem_high = list(data['最高气温'])
    tem_low = list(data['最低气温'])

    bar_width = 0.3  # 条形宽度
    index_high = np.arange(len(times))
    index_low = index_high + bar_width

    # 使用两次 bar 函数画出两组条形图
    plt.bar(index_high, height=tem_high, width=bar_width, color='red', label='高温')
    plt.bar(index_low, height=tem_low, width=bar_width, color='lightblue', label='低温')

    plt.legend()  # 显示图例
    plt.xticks(index_high + bar_width / 2, times)
    plt.ylabel('温度')  # 纵坐标轴标题
    plt.title('高温低温柱形图')  # 图形标题
    plt.savefig("./未来5天高温低温变化柱形图.jpg")
    plt.show()
    plt.close()


def tem_curve(data):
    """温度曲线绘制"""
    today = datetime.today()
    day = today.strftime('%m%d')
    for i in range(0, 5):
        day = today.strftime('%m%d')
        if day[0] == '0' and day[2] != '0':
            d = day[1] + '月' + day[2:] + '日'
        elif day[0] == '0' and day[2] == '0':
            d = day[1] + '月' + day[3] + '日'
        elif day[0] != '0' and day[2] == '0':
            d = day[0:2] + '月' + day[3] + '日'
        else:
            d = day[0:2] + '月' + day[2:] + '日'
        times.append(d)
        today = today + timedelta(+1)

    tem_low = list(data['最低气温'])
    tem_high = list(data['最高气温'])

    tem_high_ave = sum(tem_high) / 5  # 求平均高温
    tem_low_ave = sum(tem_low) / 5  # 求平均低温

    tem_max = max(tem_high)
    tem_max_date = tem_high.index(tem_max)  # 求最高温度
    tem_min = min(tem_low)
    tem_min_date = tem_low.index(tem_min)  # 求最低温度

    x = range(1, 6)
    plt.figure(1)
    plt.plot(x, tem_high, color='red', label='高温')  # 画出高温度曲线
    plt.scatter(x, tem_high, color='red')  # 点出每个时刻的温度点
    plt.plot(x, tem_low, color='blue', label='低温')  # 画出低温度曲线
    plt.scatter(x, tem_low, color='blue')  # 点出每个时刻的温度点

    plt.plot([1, 6], [tem_high_ave, tem_high_ave], c='black', linestyle='--')  # 画出平均温度虚线
    plt.plot([1, 6], [tem_low_ave, tem_low_ave], c='black', linestyle='--')  # 画出平均温度虚线
    plt.legend()
    plt.text(tem_max_date + 0.15, tem_max + 0.15, str(tem_max), ha='center', va='bottom', fontsize=10.5)  # 标出最高温度
    plt.text(tem_min_date + 0.15, tem_min + 0.15, str(tem_min), ha='center', va='bottom', fontsize=10.5)  # 标出最低温度
    plt.xticks(x, (times[0], times[1], times[2], times[3], times[4]))
    plt.title('未来5天高温低温变化曲线图')
    plt.xlabel('日期')
    plt.ylabel('摄氏度/℃')
    plt.savefig("./未来5天高温低温变化曲线图.jpg")
    plt.close()


def change_wind(wind):
    """改变风向"""
    for i in range(0, 5):
        if wind[i] == "北风":
            wind[i] = 90
        elif wind[i] == "南风":
            wind[i] = 270
        elif wind[i] == "西风":
            wind[i] = 180
        elif wind[i] == "东风":
            wind[i] = 360
        elif wind[i] == "东北风":
            wind[i] = 45
        elif wind[i] == "西北风":
            wind[i] = 135
        elif wind[i] == "西南风":
            wind[i] = 225
        elif wind[i] == "东南风":
            wind[i] = 315
    return wind


def chenge_wind_speed(list):
    """将风级转换成风速"""
    for i in range(0, 5):
        if list[i] == '':
            list[i] = 0.1
        elif list[i] == '':
            list[i] = 0.9
        elif list[i] == '':
            list[i] = 2.5
        elif list[i] == '':
            list[i] = 4.4
        elif list[i] == '':
            list[i] = 13.4
    return list


def wind_radar(data):
    """风向雷达图"""
    wind = list(data['风向'])
    wind_speed = list(data['风级'])
    wind_speed = chenge_wind_speed(wind_speed)
    wind = change_wind(wind)

    degs = np.arange(45, 361, 45)  # 起点是45度,终点是361度,间隔是45度
    temp = []
    for deg in degs:
        speed = []
        # 获取 wind_deg 在指定范围的风速平均值数据
        for i in range(0, 5):
            if wind[i] == deg:
                speed.append(wind_speed[i])
        if len(speed) == 0:
            temp.append(0)
        else:
            temp.append(sum(speed) / len(speed))
    print(temp)
    N = 8
    theta = np.arange(0. + np.pi / 8, 2 * np.pi + np.pi / 8, 2 * np.pi / 8)
    # 数据极径
    radii = np.array(temp)
    # 绘制极区图坐标系
    plt.axes(polar=True)
    # 定义每个扇区的RGB值(R,G,B),x越大,对应的颜色越接近蓝色
    colors = [(1 - x / max(temp), 1 - x / max(temp), 0.6) for x in radii]
    plt.bar(theta, radii, width=(2 * np.pi / N), bottom=0.0, color=colors)
    plt.title('未来5天风级图', x=0.2, fontsize=20)
    plt.savefig("./未来5天风级图.jpg")
    plt.close()


def weather_pie(data):
    """绘制天气饼图"""
    weather = list(data['天气'])
    dic_wea = {}
    for i in range(0, 5):
        if weather[i] in dic_wea.keys():
            dic_wea[weather[i]] += 1
        else:
            dic_wea[weather[i]] = 1
    print(dic_wea)
    explode = [0.01] * len(dic_wea.keys())
    color = ['lightskyblue', 'silver', 'yellow', 'salmon', 'grey', 'lime', 'gold', 'red', 'green', 'pink']
    plt.pie(dic_wea.values(), explode=explode, labels=dic_wea.keys(), autopct='%1.1f%%', colors=color)
    plt.title('未来5天气候分布饼图')
    plt.savefig("./未来5天气候分布饼图.jpg")
    plt.close()


plt.rcParams['font.sans-serif'] = ['SimHei']  # 解决中文显示问题
plt.rcParams['axes.unicode_minus'] = False  # 解决负号显示问题

data = pd.read_csv('weather_data1.csv')
print(data)
tem_curve(data)
wind_radar(data)
weather_pie(data)
tem1(data)
运行dataAnalysis.py文件得到柱形图,曲线图和饼图。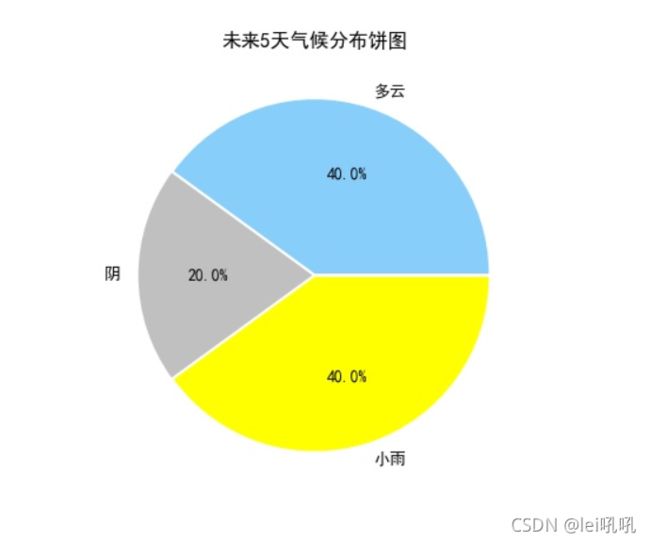
第三部分是gui界面的设计,其中设计有功能按钮:“查询”、“最低、最高温度曲线图”、“微信推送”、“更多”等功能
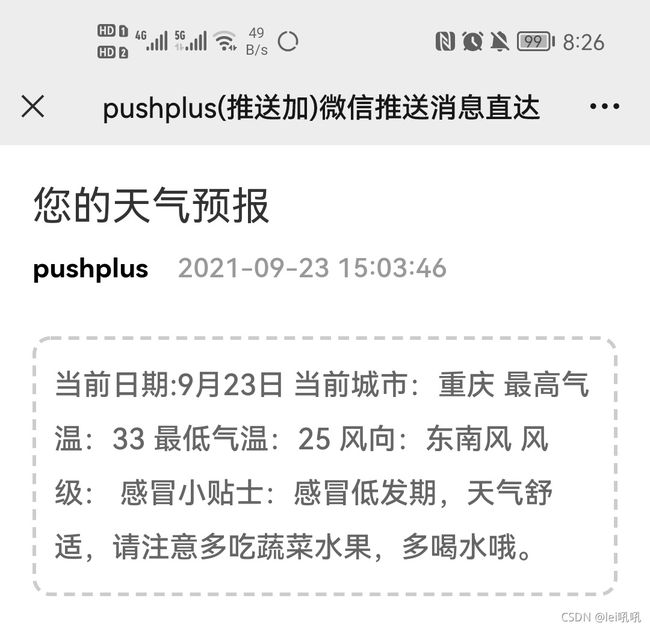
其中“微信推送”使用了push+的ip实现(具体操作可以自己去push+网站查看(搜索”pushplus(推送加)微信推送消息直达“就可以了)
这里的ip(就是代码中的token)要自己去pushplus上面获取自己的,不然查询的信息就全部发给我了(笑哭)我自从发了这个博客,就已经收到了很多的天气查询信息了。
收到的信息的样式是这样滴:
”更多“功能是使用了中国天气网的链接
(因为我的图片是.jpg的格式,所以我都是使用的canva。)
(welcome图片是我自己设置的背景图片,大家可以自己选定背景图片)
但是鉴于我在发布这篇博客之后,有很多小伙伴都向我要我的背景图片,所以我还是将我的背景图片发布一下
# Author:吼吼
# -*- codeing=utf-8 -*-
# @Time :2021/8/21 17:42
# @File: gui.py
# @Software:PyCharm
import json
import tkinter
# 注意这个是Python的标准库,就不需要去安装
from tkinter import *
from tkinter import messagebox
from datetime import timedelta, datetime
import matplotlib
import requests
from PIL import Image
from PIL import ImageTk
import pandas as pd
from matplotlib import pyplot as plt
import webbrowser


def weChat():
    curdate = "当前日期:" + times[0]  # 得到当前日期
    city = "当前城市:" + df['城市'][0]
    htemp = "最高气温:" + str(df['最高气温'][0])
    ltemp = "最低气温:" + str(df['最低气温'][0])
    wind = "风向:" + df['风向'][0]
    pro = "风级:" + df['风级'][0]
    tips="感冒小贴士:"+df["感冒小贴士"][0]
    text = curdate + '\n' + city + '\n' + htemp + '\n' + ltemp + '\n' + wind + '\n' + pro + '\n' + tips + "\n"

    token = 'df951a73b8714848b1329b7fad628865'  # 在push+网站中可以找到
    title = '您的天气预报'  # 改成你要的标题内容
    content = text  # 改成你要的正文内容
    url = 'http://www.pushplus.plus/send'

    data = {"token": token, "title": title, "content": content}
    body = json.dumps(data).encode(encoding='utf-8')
    headers = {'Content-Type': 'application/json'}
    requests.post(url, data=body, headers=headers)


def more():
    webbrowser.open("http://www.weather.com.cn")


def wind():
    root = tkinter.Toplevel()  # 实例化一个子窗口对象
    root.geometry("600x600")  # 设置窗口大小
    root.resizable(width=False, height=False)  # 设置为不可拉伸
    root.title("风级饼图")  # 设置标题

    canvas1 = tkinter.Canvas(root, width=640, height=580, bg='white')  # 设置canvas
    pil_image1 = Image.open("./未来5天风级图.jpg")  # 打开背景图片
    pil_image_resize1 = pil_image1.resize((640, 480))
    im1 = ImageTk.PhotoImage(pil_image_resize1)
    canvas1.create_image((280, 210), image=im1)  # 将图片加载到canvas来
    canvas1.place(x=10, y=80, width=640, height=580)  # 放到子屏幕当中
    root.mainloop()


def climate():
    root = tkinter.Toplevel()  # 实例化一个子窗口对象
    root.geometry("600x600")  # 设置窗口大小
    root.resizable(width=False, height=False)  # 设置为不可拉伸
    root.title("气候分布饼图")  # 设置标题

    canvas1 = tkinter.Canvas(root, width=640, height=580, bg='white')  # 设置canvas
    pil_image1 = Image.open("./未来5天气候分布饼图.jpg")  # 打开背景图片
    pil_image_resize1 = pil_image1.resize((640, 480))
    im1 = ImageTk.PhotoImage(pil_image_resize1)
    canvas1.create_image((280, 210), image=im1)  # 将图片加载到canvas来
    canvas1.place(x=10, y=80, width=640, height=580)  # 放到子屏幕当中
    root.mainloop()


def higtep():
    canvas1 = tkinter.Canvas(root, width=640, height=480, bg='white')  # 设置canvas
    pil_image1 = Image.open("./未来5天高温低温变化曲线图.jpg")  # 打开背景图片
    pil_image_resize1 = pil_image1.resize((640, 480))
    im1 = ImageTk.PhotoImage(pil_image_resize1)
    canvas1.create_image((320, 220), image=im1)  # 将图片加载到canvas来
    canvas1.place(x=290, y=250, width=640, height=480)  # 放到原屏幕当中
    root.mainloop()


def searchWeather():
    """查询天气"""
    if txt_city.get() == '':
        messagebox.showinfo("提示", "你要先输入城市哦~~")
        return
    inputcity = txt_city.get()  # 得到输入框的文字

    weather_data_list = []
    h_temp = []
    l_temp = []
    date = []
    i = 0
    for time in times:
        curdate = "日期:" + time
        city = "当前城市:" + df['城市'][i]
        htemp = "最高气温:" + str(df['最高气温'][i])
        ltemp = "最低气温:" + str(df['最低气温'][i])
        wind = "风向:" + df['风向'][i]
        pro = "风级:" + df['风级'][i]
        weather_data_list.append(curdate)
        weather_data_list.append(city)
        weather_data_list.append(htemp)
        h_temp.append(htemp)
        weather_data_list.append(ltemp)
        l_temp.append(ltemp)
        weather_data_list.append(wind)
        weather_data_list.append(pro)
        weather_data_list.append('\n')
        date.append(time)
        i = i + 1
    print(weather_data_list)
    # 将内容显示在窗体上
    weatherlistbox = tkinter.Listbox(root, bd=1, height=29, SelectionMode=None, bg="white", font=("黑体", 12))
    weatherlistbox.pack(side=LEFT, fill=BOTH)
    scrollbal_v = Scrollbar(root)
    scrollbal_v.pack(side=LEFT, fill=Y)
    i = 0
    for item in weather_data_list:
        weatherlistbox.insert("end", item)

    weatherlistbox.place(x=120, y=250)
    scrollbal_v.config(command=weatherlistbox.yview)
    weatherlistbox.config(yscrollcommand=scrollbal_v.set)

    # 添加天气温馨提示
    tips = df["感冒小贴士"][0]
    print(str(tips))
    lbl_weather_tips = tkinter.Label(root, text=tips, font=("黑体", 15), fg="black", bg="pink")
    # text参数用于指定显示的文本;font参数用于指定字体大小和字体样式;fg参数用于指定字体颜色;
    lbl_weather_tips.place(x=100, y=210, width=800, height=30)


plt.rcParams['font.family'] = 'Arial Unicode MS'
plt.rcParams['axes.unicode_minus'] = False
matplotlib.rcParams['font.family'] = 'SimHei'
matplotlib.rcParams['font.sans-serif'] = ['SimHei']  # 中文显示
matplotlib.rcParams['axes.unicode_minus'] = False  # 负号显示
df = pd.read_csv('weather_data1.csv')

"""得到日期"""
times = []
today = datetime.today()
day = today.strftime('%m%d')
for i in range(0, 5):
    day = today.strftime('%m%d')
    if day[0] == '0' and day[2] != '0':
        d = day[1] + '月' + day[2:] + '日'
    elif day[0] == '0' and day[2] == '0':
        d = day[1] + '月' + day[3] + '日'
    elif day[0] != '0' and day[2] == '0':
        d = day[0:2] + '月' + day[3] + '日'
    else:
        d = day[0:2] + '月' + day[3:] + '日'
    times.append(d)
    today = today + timedelta(+1)
print(times)

"""初始化窗口"""
root = tkinter.Tk()  # 实例化一个窗口对象
root.geometry("1000x700")  # 设置窗口大小
root.resizable(width=False, height=False)  # 设置为不可拉伸
root.title("Weather query1.0")  # 设置标题

"""添加背景图片"""
canvas = tkinter.Canvas(root, width=1000, height=170, bg='white')  # 设置canvas
pil_image = Image.open('welcome.png')  # 打开背景图片
pil_image_resize = pil_image.resize((1000, 170))
im = ImageTk.PhotoImage(pil_image_resize)
canvas.create_image((500, 135), image=im)  # 将图片加载到canvas来
canvas.place(x=0, y=0, width=1000, height=170)  # 放到屏幕当中

"""添加按钮"""
btn_search = tkinter.Button(text="查询", font=("黑体", 15), bg="pink", command=searchWeather)
btn_search.place(x=280, y=170, width=50, height=30)

btn_search = tkinter.Button(text="最低、最高温度曲线图", font=("黑体", 15), bg="pink", fg="black", command=higtep)
btn_search.place(x=330, y=170, width=220, height=30)

btn_search = tkinter.Button(text="微信推送", command=weChat, font=("黑体", 15), bg="pink", fg="black")
btn_search.place(x=790, y=170, width=100, height=30)

btn_search = tkinter.Button(text="风级饼图", font=("黑体", 15), bg="pink", fg="black", command=wind)
btn_search.place(x=550, y=170, width=100, height=30)

btn_search = tkinter.Button(text="气候分布饼图", font=("黑体", 15), bg="pink", fg="black", command=climate)
btn_search.place(x=650, y=170, width=140, height=30)

btn_search = tkinter.Button(text="退出", font=("黑体", 15), bg="pink", fg="black", command=root.quit)
btn_search.place(x=950, y=170, width=60, height=30)

btn_search = tkinter.Button(text="更多", command=more, bg="pink", fg="black", font=("黑体", 15))
btn_search.place(x=890, y=170, width=60, height=30)

"""添加标签控件:"""
# 添加提示框
lbl_weather = tkinter.Label(root, text="请输入的您的城市:", font=("黑体", 15), fg="black", bg="pink")
# text参数用于指定显示的文本;font参数用于指定字体大小和字体样式;fg参数用于指定字体颜色;
lbl_weather.place(x=0, y=170, width=190, height=30)

# 添加文本框(输入框)
txt_city = tkinter.Entry(root, font=("黑体", 15), fg="black")
txt_city.place(x=190, y=170, width=90, height=30)

# 显示窗口
root.mainloop()
注意:大家在运行过程中要严格按照getdata.py,dataAnalysis.py,gui.py三个文件的顺序运行。在每次需要查询新的城市的时候都需要将原来城市csv文件删除。

