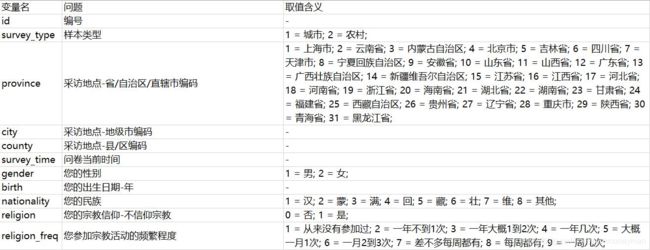
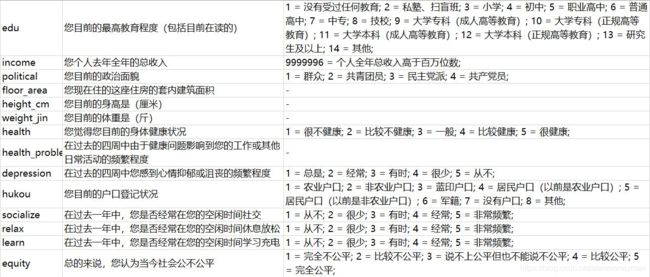
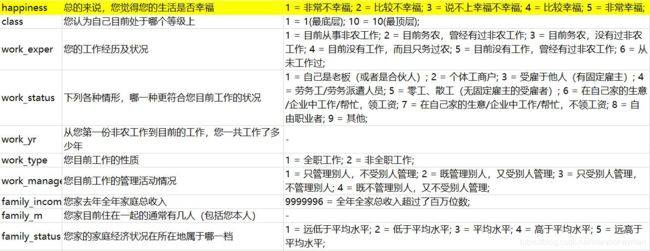
幸福感数据分析与预测
项目来自阿里云天池
目录
- 提出问题(Business Understanding )
- 理解数据(Data Understanding)
- 采集数据
- 导入数据
- 查看数据集信息
- 数据清洗(Data Preparation )
- 缺失值处理
- 时间格式处理
- 体重数据的处理
- 虚拟变量
- 数据分析与数据可视化
- 构建模型(Modeling)
- 模型评估(Evaluation)
- 提交结果
1.提出问题
幸福感是一个古老而深刻的话题,是人类世代追求的方向。与幸福感相关的因素成千上万、因人而异,大如国计民生,小如路边烤红薯,都会对幸福感产生影响。这些错综复杂的因素中,我们能找到其中的共性,一窥幸福感的要义吗?
在社会科学领域,幸福感的研究占有重要的位置。这个涉及了哲学、心理学、社会学、经济学等多方学科的话题复杂而有趣;同时与大家生活息息相关,每个人对幸福感都有自己的衡量标准。如果能发现影响幸福感的共性,生活中是不是将多一些乐趣;如果能找到影响幸福感的政策因素,便能优化资源配置来提升国民的幸福感。
我们研究的问题是:影响幸福感的因素有什么?什么样的人幸福感更强?
2.理解数据
理解数据分为三部分:
1)采集数据:这一部分,根据研究问题,采集数据;
2)导入数据:将需要分析的数据从excel文件,csv文件或者数据库中,导入到Python的数据结构中;
3)查看数据集信息,理解变量的含义。
2.1 采集数据
点击下载阿里云天池幸福感数据
数据来源:数据来自中国人民大学中国调查与数据中心主持之《中国综合社会调查(CGSS)》项目。感谢此机构及其人员提供数据协助。中国综合社会调查为多阶分层抽样的截面面访调查。
考虑到变量个数较多,部分变量间关系复杂,使用精简版数据进行研究,abbr文件为变量精简版数据。
2.2导入数据
#导入数据包
import pandas as pd
import numpy as np
#调整显示范围,显示更多的列
pd.options.display.max_rows = 10
pd.options.display.max_columns = 45
#导入训练数据集
train = pd.read_csv('./happiness_train_abbr.csv')
#导入测试数据集
test = pd.read_csv('./happiness_test_abbr.csv')
#查看数据有多少行,多少列
print(train.shape, test.shape)
(8000, 42) (2968, 41)
训练数据集有8000行数据,42列;测试数据集有2968行数据,41列。
#合并数据集,方便同时对两个数据集进行清洗
full = train.append(test, ignore_index = True, sort=False)
print (full.shape)
(10968, 42)
合并后又10968行,42列。
2.3 查看数据集信息
#查看数据信息
full.head(5)
#查看每一列的数据类型,和数据总数
full.info()
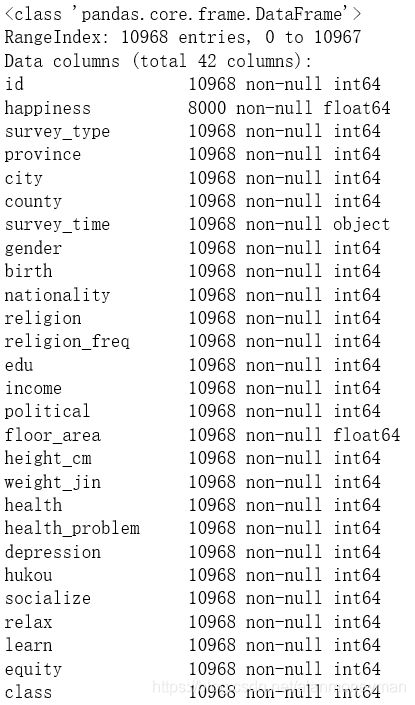
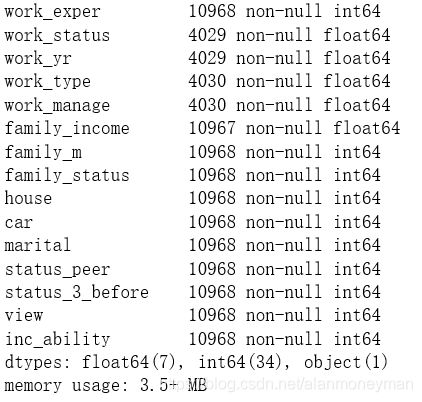
根据结果,一共有10968行数据,其中survey_time是字符串型数据,其他都是数值型数据。在这些数值型数据中,有很多是实际上是分类数据,原数据集通过对其编码变成了数值型数据。对于分类型数据,将进行One-hot编码后再分析。
family_income有1条数据缺失。work_status, work_yr, work_type, work_manage, 这4列的数据缺失非常大。
3.数据清洗(Data Preparation)
缺失值的处理
虽然数据集中有很多字段都是没有空值的,但是其中有一些包含特殊意义的值,比如-1表示不适用,-2表示不知道,-3是拒绝回答,-8是无法回答。将这些值和空值进行处理。依据情况用均值,出现频率最高的值,或者表示中间态度的选项替代。
#列名class为Python保留字,要改名,不然在操作中很可能报错
full.rename(columns={'class': 'Class'}, inplace=True)
#列nationality为-8的值,将其替换为8表示其他。
full['nationality'] = full.nationality.replace(-8, 8)
#列religion和religion_freq为-8的值,将其替换为最频繁出现的值1。
full['religion'] = full.religion.replace(-8, 1)
full['religion_freq'] = full.religion_freq.replace(-8, 1)
#列religion和religion_freq为-8的值,将其替换为最频繁出现的值1。
full['religion'] = full.religion.replace(-8, 1)
full['religion_freq'] = full.religion_freq.replace(-8, 1)
#将income列为-1,-2,-3的值,先替换为空值,再用平均值替换
full['income'] = full.income.replace([-1, -2, -3], np.nan)
full['income'] = full.income.replace(np.nan, full['income'].mean())
#列nationality为-8的值,将其替换为最频繁出现的值1。
full['political'] = full.political.replace(-8, 1)
#列health,health_problem为-8的值,将其替换为3,表示一般。
full['health'] = full.health.replace(-8, 3)
full['health_problem'] = full.health_problem.replace(-8, 3)
#列depression为-8的值,将其替换为3,表示一般。
full['depression'] = full.depression.replace(-8, 3)
#列socialize,relax,learn为-8的值,将其替换为3,表示有时。
full['socialize'] = full.socialize.replace(-8, 3)
full['relax'] = full.relax.replace(-8, 3)
full['learn'] = full.learn.replace(-8, 3)
#列equity为-8的值,将其替换为3,表示中间态度。
full['equity'] = full.equity.replace(-8, 3)
#列class为-8的值,将其替换为最频繁出现的5。
full['Class'] = full.Class.replace(-8, 5)
#将family_income列为-1,-2,-3的值,先替换为空值,再用平均值替换
full['family_income'] = full.family_income.replace([-1, -2, -3], np.nan)
full['family_income'] = full.family_income.replace(np.nan, full['family_income'].mean())
#将family_m列为-1,-2,-3的值,替换为1
full['family_m'] = full.family_m.replace([-1, -2, -3], 1)
#列family_status为-8的值,将其替换为3,表示平均水平
full['family_status'] = full.family_status.replace(-8, 3)
#将house列为-1,-2,-3的值,替换为0
full['house'] = full.house.replace([-1, -2, -3], 0)
#将car列为-8的值,替换为最频繁出现的2
full['car'] = full.car.replace(-8, 2)
#将status_peer,status_3_before,view列为-8的值,替换为差不多(一般)
full['status_peer'] = full.status_peer.replace(-8, 2)
full['status_3_before'] = full.status_3_before.replace(-8, 2)
full['view'] = full.view.replace(-8, 3)
#inc_ability缺失值过多,将inc_ability列为-8的值,替换为0
full['inc_ability'] = full.inc_ability.replace(-8, 0)
#将happiness列为-8的值,替换为3 "说不上幸福不幸福"
full['happiness'] = full.happiness.replace(-8, 3)
时间格式处理
#survey_time转换成时间格式的数据
full['survey_datetime'] = pd.to_datetime(
    full.survey_time,
    format='%Y/%m/%d %H:%M')
#计算受访者的年龄,所有问卷都是2015年填写的,所以 2015-birth 就是年龄
full['age'] = 2015 - full['birth']
体重数据的处理
数据集中包含了受访者的身高与体重。只凭体重的名义数值是不能够判断一个人的胖瘦程度的。国际上常用BMI指数衡量人的胖瘦和健康程度,我们可以将数据集中的体重转换为BMI指数再做分析。
BMI计算公式:体重(kg)/身高(m)的平方
#计算BMI指数,注意数据集中的身高单位是cm,体重的单位是斤(500g)
full['bmi'] = (full['weight_jin'] /2) / (full['height_cm'] / 100) ** 2
虚拟变量
对于分类数据,用One-hot编码,产生虚拟变量(dummy variables),都用0-1表示。
#survey_type分为2类,0=农村,1=城市
full['survey_type'] = full.survey_type.replace(2, 0)
#gender分为2类,0=女,1=男
full['gender'] = full.gender.replace(2, 0)
#民族nationality
nationalityDf = pd.DataFrame()
#使用get_dummies进行one-hot编码,列名前缀是nationality
nationalityDf = pd.get_dummies( full['nationality'] , prefix='nationality' )
nationalityDf.head(5)
#参与宗教活动频繁程度religion_freq
religion_freqDf = pd.DataFrame()
#使用get_dummies进行one-hot编码,列名前缀是religion_freq
religion_freqDf = pd.get_dummies( full['religion_freq'] , prefix='religion_freq' )
edu的选项比较多,有14种,要对其分组后再做比较。
分如下成几组
1.小学及其他,包括原数据中的1,2,3,14
2.初中,对应原数据中的4
3.高中,对应原数据中的5,6,7,8
4.大学,对应原数据中的9,10,11,12
5.研究生,对应原数据中的13
#对教育程度分组,将分组结果放在edu_group字段
bins = [0, 3, 4, 8, 12, 13, 14]
eduLabels = [1, 2, 3, 4, 5, 6]
full['edu_group'] = pd.cut(
    full.edu,
    bins,
    labels=eduLabels)
#分类的标签不能重复,edu_group值为6的换乘1
full['edu_group'] = full.edu_group.replace(6, 1)
#受教育层次edu_group
edu_groupDf = pd.DataFrame()
#使用get_dummies进行one-hot编码,列名前缀是edu_group
edu_groupDf = pd.get_dummies( full['edu_group'] , prefix='edu_group' )
#political政治面貌
politicalDf = pd.DataFrame()
politicalDf = pd.get_dummies( full['political'] , prefix='political' )
#health健康状况
healthDf = pd.DataFrame()
healthDf = pd.get_dummies( full['health'] , prefix='health' )
#health_problem健康问题的影响
health_problemDf = pd.DataFrame()
health_problemDf = pd.get_dummies( full['health_problem'] , prefix='health_problem' )
#depression心情抑郁
depressionDf = pd.DataFrame()
depressionDf = pd.get_dummies( full['depression'] , prefix='depression' )
#hukou户口
hukouDf = pd.DataFrame()
hukouDf = pd.get_dummies( full['hukou'] , prefix='hukou' )
#socialize社交
socializeDf = pd.DataFrame()
socializeDf = pd.get_dummies( full['socialize'] , prefix='socialize' )
#relax放松
relaxDf = pd.DataFrame()
relaxDf = pd.get_dummies( full['relax'] , prefix='relax' )
#learn学习
learnDf = pd.DataFrame()
learnDf = pd.get_dummies( full['learn'] , prefix='learn' )
#equity公平
equityDf = pd.DataFrame()
equityDf = pd.get_dummies( full['equity'] , prefix='equity' )
#Class等级
ClassDf = pd.DataFrame()
ClassDf = pd.get_dummies( full['Class'] , prefix='Class' )
#work_exper工作经历
work_experDf = pd.DataFrame()
work_experDf = pd.get_dummies( full['work_exper'] , prefix='work_exper' )
#family_status家庭经济状况
family_statusDf = pd.DataFrame()
family_statusDf = pd.get_dummies( full['family_status'] , prefix='family_status' )
#car是否拥有小汽车,转变成0=没有,1=有
full['car'] = full.car.replace(2, 0)
#marital婚姻状况
maritalDf = pd.DataFrame()
maritalDf = pd.get_dummies( full['marital'] , prefix='marital' )
#status_peer经济社会地位
status_peerDf = pd.DataFrame()
status_peerDf = pd.get_dummies( full['status_peer'] , prefix='status_peer' )
#status_3_before,3年来社会经济地位的变化
status_3_beforeDf = pd.DataFrame()
status_3_beforeDf = pd.get_dummies( full['status_3_before'] , prefix='status_3_before' )
#view观点
viewDf = pd.DataFrame()
viewDf = pd.get_dummies( full['view'] , prefix='view' )
#inc_ability收入合理性
inc_abilityDf = pd.DataFrame()
inc_abilityDf = pd.get_dummies( full['inc_ability'] , prefix='inc_ability' )
#删除空值的列
inc_abilityDf.drop('inc_ability_0',axis=1,inplace=True)
4 数据可视化与特征选择
4.1 描述性分析
#对于幸福感的描述性统计指标
full.happiness.describe()
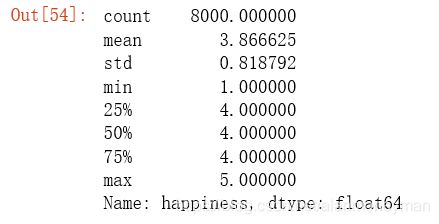
幸福感的均值为3.87,表明总体上幸福强。25%百分位数为4,表明有超过四分之三的受访者对幸福感给出4分或5分,觉得不幸福的人数不多。
不同评分的意义如下
1 = 非常不幸福; 2 = 比较不幸福; 3 = 说不上幸福不幸福; 4 = 比较幸福; 5 = 非常幸福
import matplotlib
from matplotlib import pyplot as plt
#展示整体人群的幸福状况,各选项选择的人数
happiness_count = full.groupby(
    by=['happiness'], as_index=False
)['id'].agg('count')
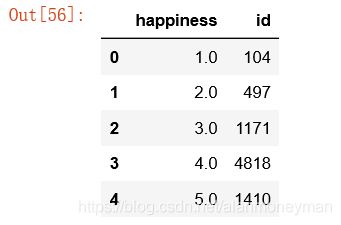
happiness_count
#将结果绘图,分别用饼图和柱状图展示。
fig = plt.figure(figsize=(10, 5))
font = matplotlib.font_manager.FontProperties(size=13)
ax1 = fig.add_subplot(1, 2, 1)
plt.pie(
    happiness_count.id,
    colors=['g', 'y', 'r', 'c', 'm'],
    labels=['1', '2', '3', '4', '5'],
    autopct='%.1f%%',
    textprops={'fontproperties': font},
    radius=1.2)
plt.title('觉得比较幸福的人占6成', size=13)
ax2 = fig.add_subplot(1, 2, 2)
plt.bar(happiness_count['happiness'], happiness_count['id'],
        color=['g', 'y', 'r', 'c', 'm'])
plt.xticks(size=13)
plt.yticks(size=13)
plt.xlabel('1 = 非常不幸福; 2 = 比较不幸福; 3 = 说不上幸福不幸福; 4 = 比较幸福; 5 = 非常幸福')
plt.title('整体人群的幸福状况', size=13)
plt.subplots_adjust(wspace=0.5)
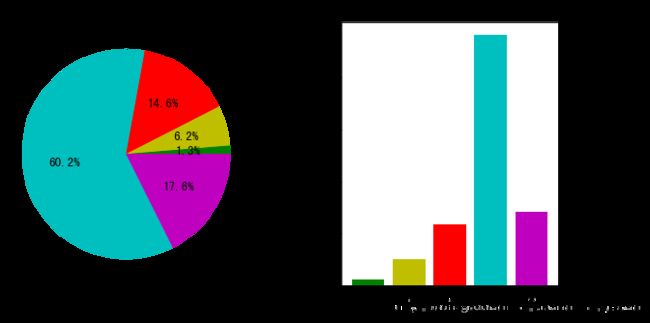
觉得幸福(包括非常幸福和比较幸福)的人,占77.8%;觉得不幸福(包括非常不幸福和比较不幸福)的人占7.5% 。
总的来说,大部分人的幸福感比较高,觉得不幸福的人群比例不高。
4.2 探索性分析
探索幸福感的差异与什么因素有关?接下来会从多个变量,对总体进行分组,查看各组的幸福感情况,并绘制统计图。
4.2.1 按照城乡分析
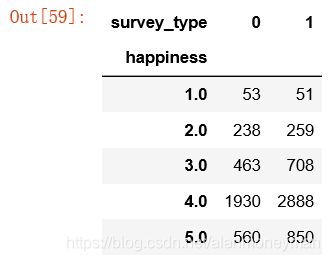
城市与农村居民的幸福感有差异吗?接下来比较城市居民与农村居民的幸福感情况。
#分别查看城乡幸福感的平均情况
survey_type_mean = full.groupby(
    by=['survey_type']
)['happiness'].agg('mean')
survey_type_mean
survey_type_result = full.pivot_table(
    values='id',
    index='happiness',
    columns='survey_type',
    aggfunc='count')
survey_type_result
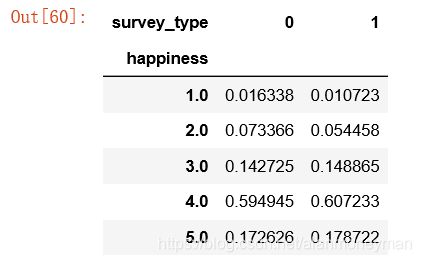
#用频数不容易比较相对百分比,所以要将组百分比归一化为1。
survey_type_result[0] = survey_type_result[0] / survey_type_result[0].sum()
survey_type_result[1] = survey_type_result[1] / survey_type_result[1].sum()
survey_type_result
bar_width=0.4
plt.bar(x=survey_type_result.index - 0.5 * bar_width, height=survey_type_result[0], label='农村', width=bar_width)
plt.bar(x=survey_type_result.index + 0.5 * bar_width, height=survey_type_result[1], label='城市', width=bar_width)
plt.title('城乡幸福感对比', size=15)
plt.ylabel('比例')
plt.xlabel('1 = 非常不幸福; 2 = 比较不幸福; 3 = 说不上幸福不幸福; 4 = 比较幸福; 5 = 非常幸福')
plt.legend()
plt.show()
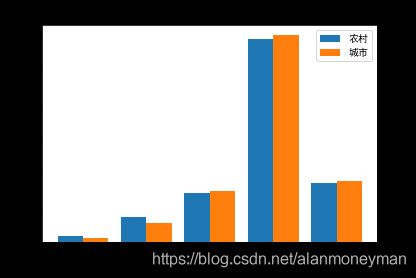
从图中可知,城市居民中感到幸福的比例比农村居民高,缺乏幸福感的比例则是农村高于城市。
总体而言,城市居民的幸福感较农村居民高,但这种差距不明显。
4.2.2 按性别分析
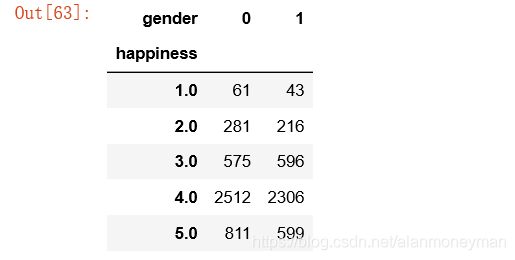
男性和女性的幸福感差异明显吗,哪个更幸福?
#查看男性、女性幸福感的平均情况
gender_mean = full.groupby(
    by=['gender']
)['happiness'].agg('mean')
gender_mean
gender_result = full.pivot_table(
    values='id',
    index='happiness',
    columns='gender',
    aggfunc='count')
gender_result
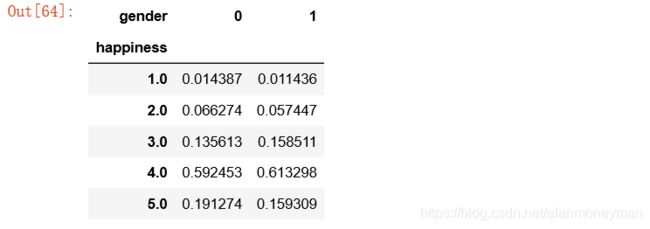
#转换成百分比
gender_result[0] = gender_result[0] / gender_result[0].sum()
gender_result[1] = gender_result[1] / gender_result[1].sum()
gender_result
bar_width=0.4
plt.bar(x=gender_result.index - 0.5 * bar_width, height=gender_result[0], label='女', width=bar_width)
plt.bar(x=gender_result.index + 0.5 * bar_width, height=gender_result[1], label='男', width=bar_width)
plt.title('性别幸福感对比', size=15)
plt.ylabel('比例')
plt.xlabel('1 = 非常不幸福; 2 = 比较不幸福; 3 = 说不上幸福不幸福; 4 = 比较幸福; 5 = 非常幸福')
plt.legend()
plt.show()
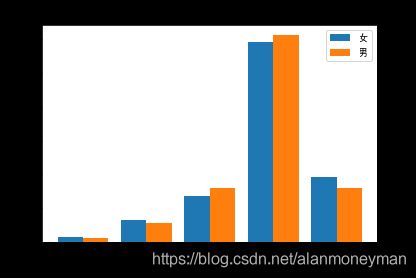
感觉非常幸福的女性占19.1%,而男性只有15.9%,感到非常幸福的女性比例明显比男性多。评价比较幸福的男性比例比女性多。有幸福感(包括比较幸福和非常幸福)的女性占78.4%,男性占77.3%,女性比男性略多。男性与女性幸福感的差异不明显。
4.2.3 按年龄分析
不同年龄阶段的人,幸福感有差异吗?
研究不同年龄的幸福感情况。首先对样本的年龄进行分类,分成5个年龄段。
按照20%, 40%, 60%, 80%百分位数设置阈值,这样使每个组的样本数大致相等。
full.age.describe(percentiles=[0.2, 0.4, 0.6, 0.8])
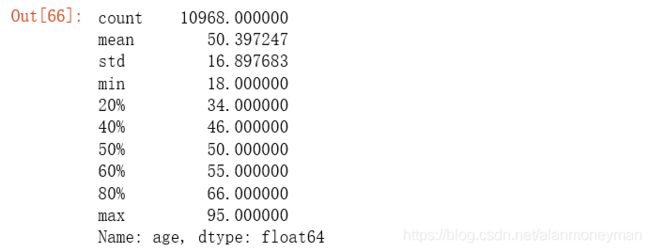
分成5个年龄段,分别为[18, 33], [34, 45], [46, 54], [55, 65], [66, 95]
#对年龄分组,将分组结果放在age_group字段
bins = [17, 33, 45, 54, 65, 100]
ageLabels = ['33岁及以下', '34-45岁', '46-54岁', '55-65岁', '66岁及以上']
full['age_group'] = pd.cut(
    full.age,
    bins,
    labels=ageLabels)
#查看各年龄层次幸福感的平均情况
age_mean = full.groupby(
    by=['age_group']
)['happiness'].agg('mean')
age_mean
#各年龄段对幸福感评价的分布情况
age_result = full.pivot_table(
    values='id',
    index='happiness',
    columns='age_group',
    aggfunc='count')
age_result
#转换成百分比
age_result['33岁及以下'] =age_result['33岁及以下'] / age_result['33岁及以下'].sum()
age_result['34-45岁'] = age_result['34-45岁'] / age_result['34-45岁'].sum()
age_result['46-54岁'] = age_result['46-54岁'] / age_result['46-54岁'].sum()
age_result['55-65岁'] = age_result['55-65岁'] / age_result['55-65岁'].sum()
age_result['66岁及以上'] = age_result['66岁及以上'] / age_result['66岁及以上'].sum()
age_result
bar_width=0.17
plt.bar(x=age_result.index - 2 * bar_width, height=age_result['33岁及以下'], label='33岁及以下', width=bar_width)
plt.bar(x=age_result.index - 1 * bar_width, height=age_result['34-45岁'], label='34-45岁', width=bar_width)
plt.bar(x=age_result.index, height=age_result['46-54岁'], label='46-54岁', width=bar_width)
plt.bar(x=age_result.index + 1 * bar_width, height=age_result['55-65岁'], label='55-65岁', width=bar_width)
plt.bar(x=age_result.index + 2 * bar_width, height=age_result['66岁及以上'], label='66岁及以上', width=bar_width)
plt.title('年龄幸福感对比', size=15)
plt.ylabel('比例')
plt.xlabel('1 = 非常不幸福; 2 = 比较不幸福; 3 = 说不上幸福不幸福; 4 = 比较幸福; 5 = 非常幸福')
plt.legend()
plt.show()
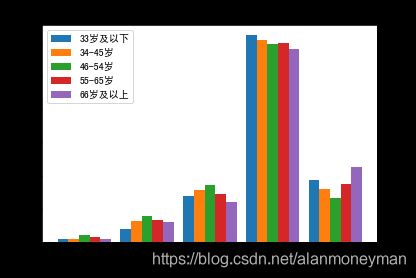
感绝非常幸福的比例,66岁以上年龄段最多,33岁以下年龄段其次,46-54岁年龄段最少。
感觉比较不幸福和非常不幸福,46-54岁年龄段的比例最大。
老年人有更多的幸福感,年轻人的幸福感也相对较高,中年人的幸福感低。各个年龄段幸福感呈现先降后升的态势。
4.2.4 从受教育程度分析
受教育程度的高低,和幸福感有关系吗?
#查看各学历层次幸福感的平均情况
edu_mean = full.groupby(
    by=['edu_group']
)['happiness'].agg('mean')
edu_mean
#各学历层次对幸福感评价的分布情况
edu_result = full.pivot_table(
    values='id',
    index='happiness',
    columns='edu_group',
    aggfunc='count')
edu_result
#转换成百分比
edu_result[1] = edu_result[1] / edu_result[1].sum()
edu_result[2] = edu_result[2] / edu_result[2].sum()
edu_result[3] = edu_result[3] / edu_result[3].sum()
edu_result[4] = edu_result[4] / edu_result[4].sum()
edu_result[5] = edu_result[5] / edu_result[5].sum()
#用0填补空值
edu_result = edu_result.fillna(0)
edu_result
bar_width=0.17
plt.bar(x=edu_result.index - 2 * bar_width, height=edu_result[1], label='小学及其他', width=bar_width)
plt.bar(x=edu_result.index - 1 * bar_width, height=edu_result[2], label='初中', width=bar_width)
plt.bar(x=edu_result.index, height=edu_result[3], label='高中', width=bar_width)
plt.bar(x=edu_result.index + 1 * bar_width, height=edu_result[4], label='大学', width=bar_width)
plt.bar(x=edu_result.index + 2 * bar_width, height=edu_result[5], label='研究生', width=bar_width)
plt.title('受教育程度幸福感对比', size=15)
plt.ylabel('比例')
plt.xlabel('1 = 非常不幸福; 2 = 比较不幸福; 3 = 说不上幸福不幸福; 4 = 比较幸福; 5 = 非常幸福')
plt.legend()
plt.show()
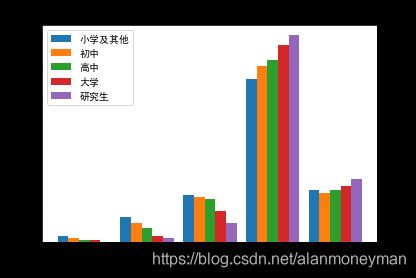
从幸福感评价的均值来看,受教育程度越高幸福感越高。在评价比较幸福和非常幸福的人群中,受教育程度越高的群体比例越高(仅一个例外是小学文化的人感觉非常幸福的比例比初中文化的高)。而在评价“"说不上幸福不幸福”、“比较不幸福”、“非常不幸福”的人群中,受教育程度越低的的群体比例越高。
可以看出,接受更多的教育,能使幸福感显著提升。或者说,受教育程度高的人幸福感更强。
4.2.5 按公平程度的评价分析
在查看数据之前,我们提出一个假设:觉得当今社会不公平的人,比觉得公平的人更加不幸福。实际情况会是怎么样的?
#分别查看公平评价幸福感的平均情况
equity_mean = full.groupby(
    by=['equity']
)['happiness'].agg('mean')
equity_mean
#各公平评价对幸福感评价的分布情况
equity_result = full.pivot_table(
    values='id',
    index='happiness',
    columns='equity',
    aggfunc='count')
equity_result
#转换成百分比
equity_result[1] = equity_result[1] / equity_result[1].sum()
equity_result[2] = equity_result[2] / equity_result[2].sum()
equity_result[3] = equity_result[3] / equity_result[3].sum()
equity_result[4] = equity_result[4] / equity_result[4].sum()
equity_result[5] = equity_result[5] / equity_result[5].sum()
equity_result
bar_width=0.17
plt.bar(x=equity_result.index - 2 * bar_width, height=equity_result[1], label='完全不公平', width=bar_width)
plt.bar(x=equity_result.index - 1 * bar_width, height=equity_result[2], label='比较不公平', width=bar_width)
plt.bar(x=equity_result.index, height=equity_result[3], label='说不上公平但也不能说不公平', width=bar_width)
plt.bar(x=equity_result.index + 1 * bar_width, height=equity_result[4], label='比较公平', width=bar_width)
plt.bar(x=equity_result.index + 2 * bar_width, height=equity_result[5], label='完全公平', width=bar_width)
plt.title('对公平的评价与幸福感', size=15)
plt.ylabel('比例')
plt.xlabel('1 = 非常不幸福; 2 = 比较不幸福; 3 = 说不上幸福不幸福; 4 = 比较幸福; 5 = 非常幸福')
plt.legend()
plt.show()
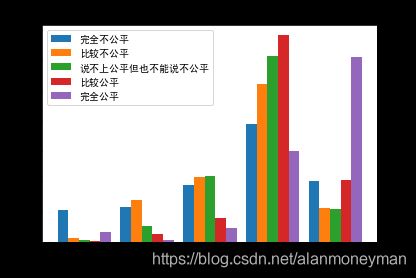
认为当今社会完全公平的人,幸福感更充分,其中超过60%的人非常幸福。
认为当今社会完全不公平的人,有超过20%的不幸福(含比较不幸福和非常不幸福),在所有人群中最高。
从某种程度上可以说,认为社会公平的人比认为社会不公平的人有更多的幸福感。
4.2.6 按社会经济地位分析
问卷中的问题是:与同龄人相比,您本人的社会经济地位怎样?认为地位较高的人会更幸福吗?
#查看社会经济地位不同的群体幸福感的平均情况
status_peer_mean = full.groupby(
    by=['status_peer']
)['happiness'].agg('mean')
status_peer_mean
#社会经济地位与幸福感的数据透视表
status_peer_result = full.pivot_table(
    values='id',
    index='happiness',
    columns='status_peer',
    aggfunc='count')
status_peer_result
#转换成百分比
status_peer_result[1] = status_peer_result[1] / status_peer_result[1].sum()
status_peer_result[2] = status_peer_result[2] / status_peer_result[2].sum()
status_peer_result[3] = status_peer_result[3] / status_peer_result[3].sum()
status_peer_result
bar_width=0.25
plt.bar(x=status_peer_result.index - 1 * bar_width, height=status_peer_result[1], label='较高', width=bar_width)
plt.bar(x=status_peer_result.index, height=status_peer_result[2], label='差不多', width=bar_width)
plt.bar(x=status_peer_result.index + 1 * bar_width, height=status_peer_result[3], label='较低', width=bar_width)
plt.title('对自身经济社会地位的评价与幸福感', size=15)
plt.ylabel('比例')
plt.xlabel('1 = 非常不幸福; 2 = 比较不幸福; 3 = 说不上幸福不幸福; 4 = 比较幸福; 5 = 非常幸福')
plt.legend()
plt.show()
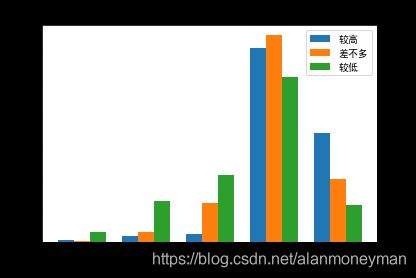
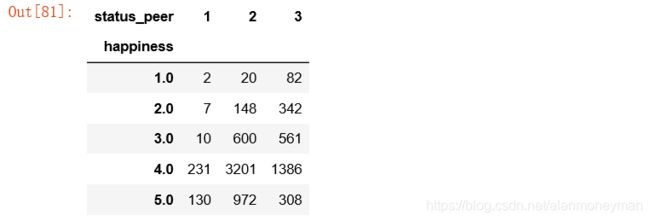
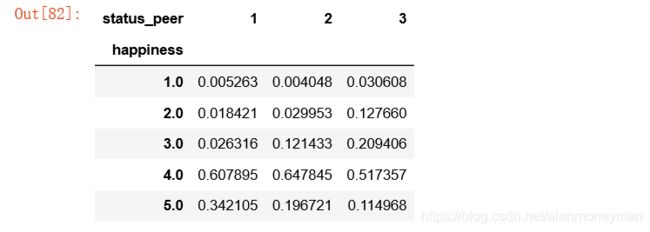
与同龄人相比,认为自身经济社会地位较高的人,有34.2%的认为非常幸福,有60.8%的认为比较幸福,这一群体的幸福感也高。
认为自身经济社会地位与同龄人相比较低的人,更多地感到不幸福。
4.2.7 从认为自己的收入是否合理的角度分析
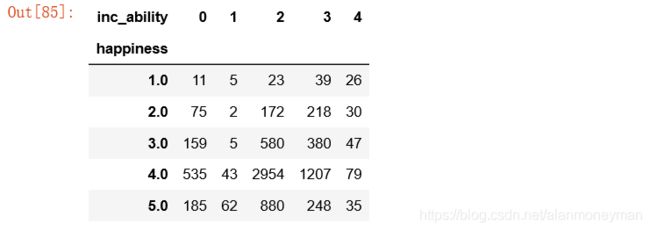
考虑到自身的能力和工作状况,认为目前的收入不合理的人,是不是相对不幸福?
#按收入是否合理分类,幸福感的平均数
inc_ability_mean = full.groupby(
    by=['inc_ability']
)['happiness'].agg('mean')
inc_ability_mean
#收入是否合理与幸福感的数据透视表
inc_ability_result = full.pivot_table(
    values='id',
    index='happiness',
    columns='inc_ability',
    aggfunc='count')
inc_ability_result
#转换成百分比,忽略选择“无法回答”的数据
inc_ability_result[1] = inc_ability_result[1] / inc_ability_result[1].sum()
inc_ability_result[2] = inc_ability_result[2] / inc_ability_result[2].sum()
inc_ability_result[3] = inc_ability_result[3] / inc_ability_result[3].sum()
inc_ability_result[4] = inc_ability_result[4] / inc_ability_result[4].sum()
inc_ability_result
bar_width=0.2
plt.bar(x=inc_ability_result.index - 1.5 * bar_width, height=inc_ability_result[1], label='非常合理', width=bar_width)
plt.bar(x=inc_ability_result.index - 0.5 * bar_width, height=inc_ability_result[2], label='合理', width=bar_width)
plt.bar(x=inc_ability_result.index + 0.5 * bar_width, height=inc_ability_result[3], label='不合理', width=bar_width)
plt.bar(x=inc_ability_result.index + 1.5 * bar_width, height=inc_ability_result[4], label='非常不合理', width=bar_width)
plt.title('收入是否合理与幸福感', size=15)
plt.ylabel('比例')
plt.xlabel('1 = 非常不幸福; 2 = 比较不幸福; 3 = 说不上幸福不幸福; 4 = 比较幸福; 5 = 非常幸福')
plt.legend()
plt.show()
4.3 特征选择
#设置一个新的DataFrame,在新的DataFrame上添加虚拟变量以替代原来的变量
nfull= full
#添加虚拟变量,然后删除原来的变量
nfull = pd.concat([full, nationalityDf, religion_freqDf, edu_groupDf,
                   politicalDf, healthDf, health_problemDf, depressionDf,
                   hukouDf, socializeDf, relaxDf, learnDf, equityDf,
                   ClassDf, work_experDf, family_statusDf, maritalDf,
                   status_peerDf, status_3_beforeDf, viewDf,
                   inc_abilityDf],axis=1)
#work_exper, work_status, work_yr, work_type这几个变量缺失的数据太多,将其删除
nfull.drop(['nationality', 'religion_freq', 'edu', 'edu_group', 'political',
            'health', 'health_problem', 'depression', 'hukou', 'socialize',
            'relax', 'learn', 'equity', 'Class', 'work_exper',
            'family_status', 'marital', 'status_peer', 'status_3_before',
            'view', 'inc_ability', 'weight_jin', 'work_exper',
            'work_status','work_yr', 'work_type',
            'age_group'],axis=1,inplace=True)
nfull.head(5)
#相关性矩阵
corrDf = nfull.corr()
corrDf
#查看各个特征与幸福感(happiness)的相关系数,ascending=False表示按降序排列
pd.options.display.max_rows = 20
corrDf['happiness'].sort_values(ascending =False)
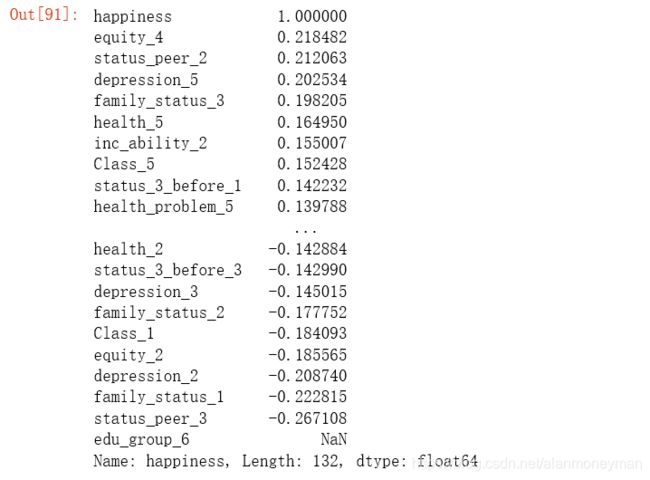
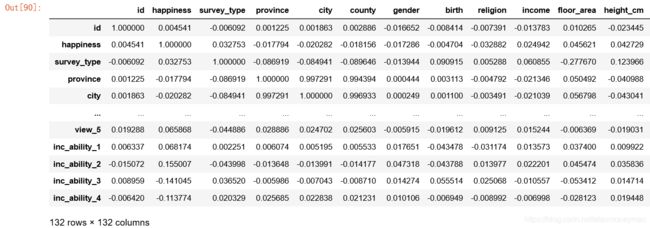
从结果看出,认为社会比较公平equity_4,与同龄人相比地位差不多status_peer_2,从不感到沮丧depression_5与幸福感有较强的正相关性。
与同龄人相比地位低status_peer_3,家庭经济状况远低于平均水平family_status_1,经常感到沮丧depression_2与幸福感有较强的负相关性。
根据相关系数,选择这几个的变量作为模型的输入:
status_peerDf, family_status, equityDf, depressionDf, ClassDf
#特征选择
full_X = pd.concat([status_peerDf,
                    family_statusDf,
                    equityDf,
                    depressionDf,
                    ClassDf] , axis=1 )
full_X.head(5)
5 构建模型
用训练数据和某个机器学习算法得到机器学习模型,用测试数据评估模型
5.1 建立训练数据集和测试数据集
测试数据集中没有happiness值,是要通过算法预测出的。所以不能用于评估模型。
从数据集中拆分出训练数据集(用于训练模型)和测试数据集(用于模型评估)。
#训练数据集有8000行
sourceRow=8000
#从特征集合full_X中提取原始数据集,提取前8000行数据时
#原始数据集:特征
source_X = full_X.loc[0:sourceRow-1, :]
#原始数据集:标签
source_y = nfull.loc[0:sourceRow-1, 'happiness']
#预测数据集:特征
pred_X = full_X.loc[sourceRow:,:]
#查看两个数据集有多少行
print('原始数据集有多少行:',source_X.shape[0])
print('预测数据集有多少行:',pred_X.shape[0])
原始数据集有多少行: 8000
预测数据集有多少行: 2968
from sklearn.model_selection import  train_test_split
#用train_test_split函数,从样本中随机的按比例选取train data和test data
#建立模型用的训练数据集和测试数据集
train_X, test_X, train_y, test_y = train_test_split(source_X ,
                                                    source_y,
                                                    train_size=.8)
#输出数据集大小
print ('原始数据集特征:',source_X.shape,
       '训练数据集特征:',train_X.shape ,
      '测试数据集特征:',test_X.shape)

print ('原始数据集标签:',source_y.shape,
       '训练数据集标签:',train_y.shape ,
      '测试数据集标签:',test_y.shape)
原始数据集特征: (8000, 28) 训练数据集特征: (6400, 28) 测试数据集特征: (1600, 28)
原始数据集标签: (8000,) 训练数据集标签: (6400,) 测试数据集标签: (1600,)
#原始数据查看
source_y.head()
5.2 导入算法
运用逻辑回归算法
#第1步:导入算法
from sklearn.linear_model import LogisticRegression
#第2步:创建模型:逻辑回归(logistic regression)
model = LogisticRegression()
#第3步:训练模型
model.fit( train_X , train_y )
6 评估模型
#查看模型的正确率
model.score(test_X , test_y )
7 方案实施
#运用模型,对幸福感进行预测
pred_Y = model.predict(pred_X)
#生成的结果是浮点型数据
pred_Y
![]()
#题目要求上传的结果要为整数型,所以要进行转换
pred_Y=pred_Y.astype(int)
#受访者id
id = full.loc[sourceRow:,'id']
#把预测结果放到数据框中:列名id是受访者编号,列名happiness预测的幸福感
predDf = pd.DataFrame(
    { 'id': id ,
     'happiness': pred_Y } )
predDf.head()
#将结果保存为csv文件,最后将这个文件上传至阿里云天池,提交结果
predDf.to_csv( './happiness_pred.csv' , index = False )
作者:钱奇天

