【图像增强】基于粒子群优化和模拟退火的图像增强算法研究Matlab代码
✅作者简介:热爱科研的Matlab仿真开发者,修心和技术同步精进,matlab项目合作可私信。
个人主页:Matlab科研工作室
个人信条:格物致知。
⛄ 内容介绍
由于图像中所出现的信号多出现在低分量部分,而高频分量部分易出现图像模糊的问题能得到解决,从而凸显图像中的重要信息,弱化或清除不需要的信息,以使图像更为清晰.本文选取有效且易实现的程序语言及算法,进一步增强图像构建框架,根据图像所成效果来进行程序设计以达到目的实现,并完善其功能.对图像进行检验,逐步完善整个算法程序,最终得到所需效果图.
⛄ 部分代码
%% PSO + SA Image Segmentation
% Empowering traditional clustering techniques with evolutionary
% algorithms, here two strong ones, namely particle swarm optimization and
%% Cleaning the Stage
clc;
clear;
close all;
warning('off');
%% Calculate Distance Matrix
% Create the Cluster Center
g=reshape(centers,3,clusteres)';
% Create a Distance Matrix
d = pdist2(X, g);
% Assign Clusters and Find Closest Distances
[dmin, ind] = min(d, [], 2);
% Sum of Cluster Distance
WCD = sum(dmin);
% Fitness Function of Centers Sum
z=WCD;
% Final Segmented Image
SA_Segmented=reshape(ind,s1,s2);
PSOSAuint=uint8(SA_Segmented);
ColorSeg = labeloverlay(Gray,PSOSAuint);
%
medgray = medfilt2(SA_Segmented,[5 5]);
%
redChannel = ColorSeg(:,:,1); % Red channel
greenChannel = ColorSeg(:,:,2); % Green channel
blueChannel = ColorSeg(:,:,3); % Blue channel
medcolor1 = medfilt2(redChannel,[4 6]);
medcolor2 = medfilt2(greenChannel,[4 6]);
medcolor3 = medfilt2(blueChannel,[4 6]);
medrgb = cat(3, medcolor1, medcolor2, medcolor3);
%% Plot PSO-SA Segmented Result
disp(['Error Is: ' num2str(Error)]);
figure('units','normalized','outerposition',[0 0 1 1])
subplot(2,3,1)
subimage(MainOrg);title('Original');
subplot(2,3,2)
subimage(Gray);title('Gray');
subplot(2,3,3)
imshow(SA_Segmented,[]);
title(['PSO-SA Gray Segmented, Clusters = ' num2str(clusteres)]);
subplot(2,3,4)
imshow(ColorSeg,[]);
title(['PSO-SA Color Segmented, Clusters = ' num2str(clusteres)]);
subplot(2,3,5)
imshow(medgray,[]);
title(['PSO-SA Gray Median Filtered ']);
subplot(2,3,6)
imshow(medrgb,[]);
title(['PSO-SA Color Median Filtered']);
% That's it, GoodBye :|
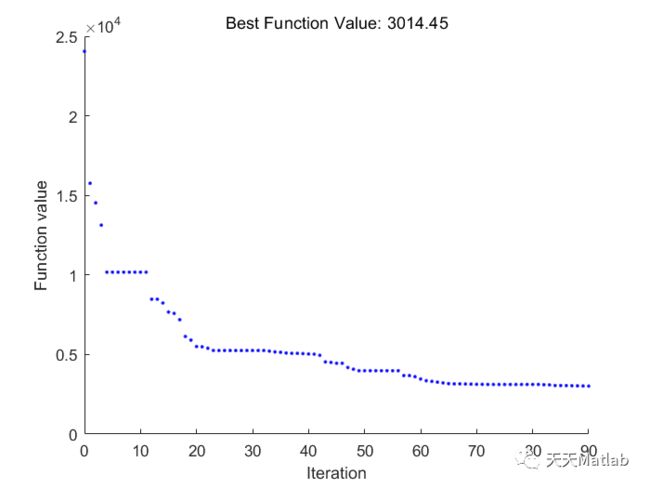
⛄ 运行结果
⛄ 参考文献
[1]朱逢园. 基于MATLAB的图像增强算法研究及实现[J]. 价值工程, 2020, 39(25):2.
[2]吕丹, 童创明, 钟卫军. 基于粒子群和模拟退火算法的混合算法研究[J]. 计算机工程与设计, 2011, 32(2):4.
⛄ 完整代码
❤️部分理论引用网络文献,若有侵权联系博主删除
❤️ 关注我领取海量matlab电子书和数学建模资料


