tensorflow2.x多层感知机模型参数量和计算量的统计
当创建了一个多层感知机模型后,如何调用接口获取该模型的参数量和计算量?首先,打印出模型结构,可通过graphviz模块实现
# 加载模型
model = keras.models.load_model(modelPath)
tf.keras.utils.plot_model(model, to_file='model.png', show_shapes=True)
可得到模型层次结构
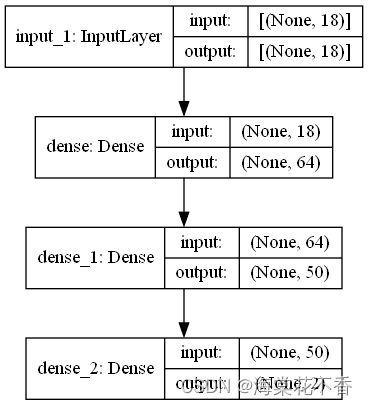
即模型的输入层为(,18),由N * 18的二维数组,中间层分别为64和50个节点。最后得到N * 2的输出节点。其中N表示样本个数。调用相关接口可打印出模型的参数量
# 加载模型
model = keras.models.load_model(modelPath)
model.summary()
Layer (type) Output Shape Param #
input_1 (InputLayer) [(None, 18)] 0
dense (Dense) (None, 64) 1216
dense_1 (Dense) (None, 50) 3250
dense_2 (Dense) (None, 2) 102
Total params: 4,568
Trainable params: 4,568
Non-trainable params: 0
可知模型的参数量计算为(18+1)* 64 + (64+1)* 50 + (50+1)*2 = 4568。
模型的计算量如何统计?在tensorflow2.0以上需要用到keras_flops模块中的get_flops函数
from keras_flops import get_flops
...
# 加载模型
model = keras.models.load_model(modelPath)
get_flops(model)
可得到类似下面的输出
Model Analysis Report====
Doc:
scope: The nodes in the model graph are organized by their names, which is hierarchical like filesystem.
flops: Number of float operations. Note: Please read the implementation for the math behind it.Profile:
node name | # float_ops
_TFProfRoot (–/9.03k flops)
healthy/dense_1/MatMul (6.40k/6.40k flops)
healthy/dense/MatMul (2.30k/2.30k flops)
healthy/dense_2/MatMul (200/200 flops)
healthy/dense/BiasAdd (64/64 flops)
healthy/dense_1/BiasAdd (50/50 flops)
healthy/dense_2/Softmax (10/10 flops)
healthy/dense_2/BiasAdd (2/2 flops)End of Report====
因此可知整个模型的计算量为9.03k flops。
模型在机器上跑起来后,如何知道该模型对cpu和内存的消耗情况?可使用psutil模块获取相关指标。
import os
import sys
import time
import psutil
...
def main(modelPath="./model"):
    pid = os.getpid()
    p = psutil.Process(pid)
    interval = 1
    model = keras.models.load_model(modelPath)
    input = np.expand_dims(list(range(18)), 0)
    cnt = 40

    with open("process_monitor_" + str(pid) + ".csv", "a+")  as f:
         f.write("time,cpu%,mem%\n")
         while(cnt):
             current_time = time.strftime('%Y%m%d-%H%M%S',time.localtime(time.time()))
             cpu_percent = p.cpu_percent()
             mem_percent = p.memory_percent()
             line = current_time + ',' + str(cpu_percent) + ',' + str(mem_percent)
             print("line:", line)
             f.write(line + "\n")
             result = model.predict(input)
             print("result:", result)
             time.sleep(interval)
             cnt = cnt - 1

if __name__ == '__main__':
    main()
运行后,当前目录会生成一个csv文件,记录了该模型运行后cpu和内存的消耗情况
| time | cpu% | mem% |
|---|---|---|
| 20221227-214848 | 0 | 1.499115212 |
| 20221227-214849 | 9.9 | 1.547653878 |
| 20221227-214850 | 3 | 1.551227276 |
| 20221227-214851 | 1.5 | 1.553932141 |
| 20221227-214852 | 3 | 1.555966993 |
| 20221227-214854 | 3 | 1.556488113 |
| 20221227-214855 | 3 | 1.556587374 |
| … | … | … |
通过原始数据绘制出趋势图

总结
-
采用graphviz和pydot模块,绘制网络模型结构
-
采用keras_flops模块统计模型的计算量
-
使用model.summary接口统计模型参数量
-
使用psutil模块统计模型运行时的资源消耗情况
参考文档
python实现监控指定进程的cpu和内存使用率
Python常用库之psutil使用指南
如何计算 LSTM 的参数量
tf.keras计算FLOPs