python opencv绘制散点热力图applyColorMap
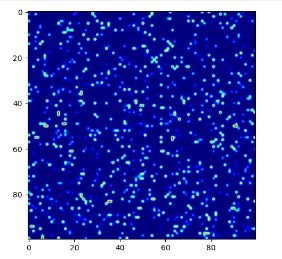
开始用的matplot ,结果这东西图尺寸稍大点就画不好, 啥也不是, 边长大于100保存的图啥也看不见
vals = []
pos = []
mat = []
for i in range(1000):
    vals.append(random.uniform(5.0, 200.0))
    pos.append(random.randint(0, 10000))
mat = [0] * 10000
for i, p in enumerate(pos):
    mat[p] = vals[i]
mat = np.array(mat)
mat = mat.reshape((100, 100))


plt.imshow(mat, cmap=plt.cm.jet, interpolation="bilinear")
plt.savefig('./figures/test.png')
plt.show()
# 2021年4月25日,后来发现可能设置matplot的分辨率值可以解决这个问题
# plt.rcParams['savefig.dpi'] = 300 #图片像素
#plt.rcParams['figure.dpi'] = 300 #分辨率
________________________________________
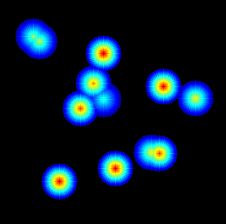
所以最后还是在opencv的基础上自己写了方法
def heat_map(data, map_size=1000):
    """
    绘制散点热图
    Args:
        data: 数据结构为list[(int,int,value)]
        map_size: 画布大小
    Returns:热力图

    """
    map = np.array([0] * pow(map_size, 2), dtype=np.uint8).reshape((map_size, map_size))

    for d in data:
        u = d[0]
        v = d[1]
        val = min(255, int(d[2] * 200))
        attention(u, v, val, map)

    heat_img = cv2.applyColorMap(map, cv2.COLORMAP_JET)  # 注意此处的三通道热力图是cv2专有的GBR排列
    heat_img[(heat_img[:, :, 0] == 128) & (heat_img[:, :, 1] == 0) & (heat_img[:, :, 2] == 0)] = [0, 0, 0]
    heat_img = cv2.transpose(heat_img)
    cv2.imwrite("./figures/heat_map.png", heat_img, [cv2.IMWRITE_PNG_COMPRESSION, 0])


def attention(u, v, val, map, r=20):
    shape = map.shape
    w, h = shape[0], shape[1]

    intensity = np.linspace(val, 0, r, dtype=np.uint8)

    for x in range(max(0, u-r), min(w, u+r)):
        for y in range(max(0, v-r), min(h, v+r)):
            distance = math.ceil(math.sqrt(pow(x-u, 2) + pow(y-v, 2)))

            if distance < r:
                if map[x][y] == 0:
                    map[x][y] = intensity[distance]
                else:
                    map[x][y] = max(map[x][y], intensity[distance])

