ProTICS包的介绍(根据生信技能树Jimmy老师分享的乳腺癌分子分型包资料整理)
ProTICS包的介绍(根据生信技能树Jimmy老师分享的乳腺癌分子分型包资料整理,感谢Jimmy老师!)
- 1、设置环境
- 2、Part1的结果
- 3、Part2的结果
- 4、Part3的结果
- 5、相关函数
亮点:尽管对选定组织学亚型中肿瘤浸润淋巴细胞的预后相关性进行了大量研究,但很少有研究系统地报道了免疫细胞在分子亚型中的预后影响,如机器学习方法对多组学数据集的量化。本文描述了一种新的计算框架ProTICS,以量化肿瘤微环境中免疫细胞比例的差异,并估计它们在不同亚型中的预后效应。
期刊: Briefings in Bioinformatics
论文:ProTICS reveals prognostic impact of tumor infiltrating immune cells in different molecular subtypes
Github link: https://github.com/liu-shuhui/ProTICS
ProTICS是由三部分组成的,三部分各有目的。后面部分的执行取决于前面部分的结果。
1、设置环境
#请安装下面的包
library(data.table)
library(dplyr)
library(rTensor)
library(nnTensor)
library(survival)
library(survminer)
library(edgeR)
library(limma)
library(Glimma)
library(gplots)
library(org.Mm.eg.db)
library(grDevices)
library(pheatmap)
library(forestplot)
2、Part1的结果
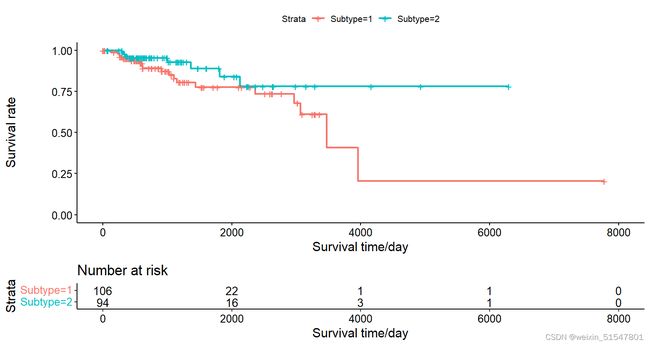
# 通过运行NTD方法发现分子亚型。这个例子中,患者被分为两种癌症亚型。
# 可视化两种癌症亚型的总体生存分析

#输入数据
data1<-fread(file = "./Data/data1.txt",header = T)  ##读取基因表达数据
data2<-fread(file = "./Data/data2.txt",header = T)  ##读取DNA甲基化数据
clinicdata<-fread(file ="./Data/clinic_Data.txt",header = T)
colnames(clinicdata)<-c("patient_id", "death", "survival")

source("./R/functions/normalization.R")
source("./R/functions/NTD_subtyping.R")
## k=2 是一个示例
Subtype= NTD_subtyping(data1,data2,k=2, n=100)

survivaldata<-cbind(clinicdata,Subtype)
write.table(survivaldata, file = "overallsurvival_subtypes.txt",
            sep = "\t", col.names = T, quote = F, row.names = F)
survdiff(Surv(survival,death)~Subtype, data=survivaldata)
survival_out<-survfit(Surv(survival,death)~Subtype, data=survivaldata)
ggsurvplot(survival_out, data = survivaldata, risk.table = T,xlab="Survival time/day", ylab="Survival rate")
3、Part2的结果
# 两种癌症亚型之间特征基因的差异表达(DE)分析,可视化所选DE基因的热图
sig_expr <- fread("./Data/signature_count.txt",sep = "\t",header = TRUE) #行是特征基因
survival_data <- fread("overallsurvival_subtypes.txt", sep = "\t",header = TRUE)
subtypes<-survival_data$Subtype

ID<- which(subtypes==1 | subtypes==2)
Surv<-survival_data[ID,]
seqd<-dplyr::select(sig_expr,c(colnames(sig_expr)[1],Surv$patient_id))   #select用dplyr::select
source("./R/functions/subtypes_DEA.R")
GS<-subtypes_DEA(Surv,seqd)

# 差异表达基因的热图
sig_expr<-sig_expr[is.element(sig_expr$symbol,GS),]
IDD<-c(which(subtypes==1),which(subtypes==2))
survd_new<-survival_data[IDD,]
sigdata<-dplyr::select(sig_expr,c(colnames(sig_expr)[1],survd_new$patient_id))  #dplyr::select

anno_c<-data.frame(Types = factor(survd_new$Subtype,c("1","2"),c("Sub1","Sub2")))
colnames(anno_c)<-c("  ")
row.names(anno_c)<-survd_new$patient_id

source("./R/functions/normalization.R")
data<-normalization(log2(sigdata[,-1]+1))

rownames(data)<-sigdata$symbol
pheatmap(data,cluster_rows=T,
         color = colorRampPalette(c( "#0077FF","#FFEEFF","#FF7700"))(1000),
         cluster_cols=F,show_rownames = TRUE,show_colnames=F,
         annotation=anno_c,annotation_legend=TRUE,main="dataset")
4、Part3的结果
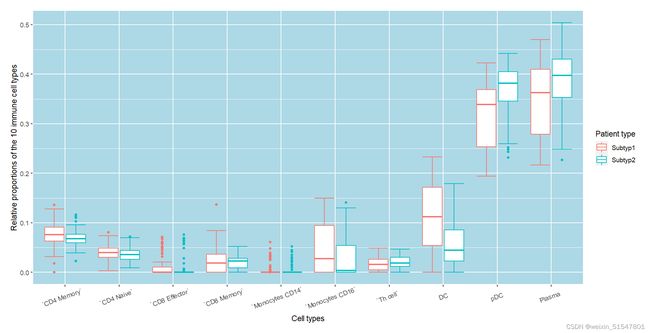
#1、10种免疫细胞在不同分子亚型中的比例分布
#2.1使用单因素cox回归分析subtypes1型中单免疫细胞预后
#2.2使用多变量cox回归分析subtypes1中10种免疫细胞类型的预后

survdata <- fread("./output/overallsurvival_subtypes.txt", sep = "\t",header = TRUE)
cell<-fread(file = "./Data/CellProportion.txt", sep = "\t",header = T)

# 删掉不是免疫细胞类型的[16:18]列。
cell<-cell[,-c(16:18)]

id=which(apply(cell[,-1],2,var)>1e-05)+1  # 去除方差非常小的列。
cell_new<-dplyr::select(cell,c(colnames(cell)[c(1,id)]))  #dplyr::select

# 免疫细胞类型的列名
covariates<-c("`CD4 Naive`","`CD4 Memory`","`CD8 Memory`",
              "`CD8 Effector`", "`Th cell`", "`Monocytes CD16`",
              "`Monocytes CD14`","DC","pDC","Plasma")

## 1. 绘制10种免疫细胞在不同分子亚型中的比例分布
`Cell types` = c(rep(covariates, each=length(which(survdata$Subtype==1))),
                 rep(covariates, each=length(which(survdata$Subtype==2))))
`Patient type` = c(rep(c("Subtyp1"),each=length(which(survdata$Subtype==1))*10),
                   rep(c("Subtyp2"),each=length(which(survdata$Subtype==2))*10))

ID1<-sapply(survdata$patient_id[which(survdata$Subtype==1)],
            function(x) which(cell_new$Mixture==x))
ID2<-sapply(survdata$patient_id[which(survdata$Subtype==2)],
            function(x) which(cell_new$Mixture==x))

`Relative proportions of the 10 immune cell types` <-c(as.vector(as.matrix(cell_new[ID1,-1])),
                                                       as.vector(as.matrix(cell_new[ID2,-1])))

data<-data.frame(`Cell types`,`Patient type`,`Relative proportions of the 10 immune cell types`)


data$Cell.type <- factor(data$Cell.type,levels=covariates,ordered = TRUE)
ggplot(data, aes(`Cell types`, y=`Relative proportions of the 10 immune cell types`, color=`Patient type`)) +
  theme(
    panel.background = element_rect(linetype = 1, colour = "white", size = 1,fill = "lightblue"),
    axis.text.x = element_text(angle = 20, hjust = 0.6,vjust = 0.75),
    plot.title = element_text(colour = "black",face = "bold",size = 12, vjust = 1),
    plot.margin = unit(c(0.2, 0.2, 0.2, 0.2), "inches")
  )+
  stat_boxplot(geom ='errorbar', width = 0.8) +
  geom_boxplot(width = 0.8)
facet_grid(.~Cell.type, scales = "free_x")
## 2. 免疫细胞类型预后关联的森林图

surv_sub<-survdata[which(survdata$Subtype==1),]
surv_sub$survival<-scale(surv_sub$survival,center = FALSE, scale = TRUE)

ID<-sapply(surv_sub$patient_id, function(x) which(cell_new$Mixture==x))
cell_new<-cell_new[ID,-1]
#cell_new<-logcell<-log2(cell_new+1)
cutoff<-as.matrix(apply(cell_new,2,median))

tem<-t(replicate(dim(cell_new)[1],cutoff[,1]))
mat_bip<-as.matrix(cell_new>tem)
mat_bip[mat_bip==TRUE]<-1

data1<-cbind(surv_sub,mat_bip)

# 2.1单变量 cox 回归
source("./R/functions/uni_cox.R")
result<-uni_cox(covariates,data1)
res1<-result[[1]]
res2<-result[[2]]
# 森林图
forestplot(res1, mean = res2$HR, lower = res2$lower, upper = res2$upper,
           graph.pos = 2,graphwidth = unit(18,"mm"),
           hrzl_lines = list("2" = gpar(lty=2,columns=1:4)),
           is.summary = c(TRUE,rep(FALSE,10)),
           txt_gp = fpTxtGp(ticks = gpar(cex=0.8),summary = gpar(cex=0.8),cex = 0.8),
           boxsize = 0.2,
           line.margin = unit(6,"mm"),
           lineheight = unit(6,"mm"),
           col=fpColors(box="blue",line="blue",summary="blue"),
           clip = c(0,5),
           xticks = c(0, 0.5, 1, 2,3,4,5),
           lwd.ci=2, ci.vertices=TRUE, ci.vertices.height = 0.12,
           colgap = unit(2,"mm"),zero = 1,
           title = "Subtype 1")
# 2.2多变量cox回归
source("./R/functions/multi_cox.R")
result<-multi_cox(covariates,data1)
res1<-result[[1]]
res2<-result[[2]]
# 森林图
forestplot(res1, mean = res2$HR, lower = res2$lower, upper = res2$upper,
           graph.pos = 2,graphwidth = unit(18,"mm"),
           hrzl_lines = list("2" = gpar(lty=2,columns=1:4)),
           is.summary = c(TRUE,rep(FALSE,10)),
           txt_gp = fpTxtGp(ticks = gpar(cex=0.8),summary = gpar(cex=0.8),cex = 0.8),
           boxsize = 0.2,
           line.margin = unit(6,"mm"),
           lineheight = unit(6,"mm"),
           col=fpColors(box="blue",line="blue",summary="blue"),
           clip = c(0,5),
           xticks = c(0, 0.5, 1, 2,3,4,5),
           lwd.ci=2, ci.vertices=TRUE, ci.vertices.height = 0.12,
           colgap = unit(2,"mm"),zero = 1,
           title = "Subtype 1")
5、相关函数
# 1、NTD_subtyping  NTD分型
# 该函数用于整合多组学,执行非负Tucker分解算法,然后通过matrice_B将患者分配到不同的组。

NTD_subtyping <- function(data1,data2,k,n){
  ## 定义一个三模张量
  arr <- array(0,dim = c(dim(data1[,-1]),2)) # 行:基因;列:病人(样本)
  arrT <- as.tensor(arr)

  arrT[,,1] <- unlist(normalization(data1[,-1]))
  arrT[,,2] <- unlist(normalization(data2[,-1]))

  ##k:亚型的数量;n:交互步数(默认值:100)
  output <- NTD(arrT, rank=c(k, k, k),num.iter=n)
  ## matrice_B保存了患者的潜在因素信息
  matrice_B<-t(output$A[[2]])
  ## 亚型信息
  group<-max.col(matrice_B)
  return(group)
}

# 2、multi_cox 多因素cox
multi_cox<-function(covariates,data){

  res.cox <- coxph(Surv(survival, death) ~ `CD4 Naive` + `CD4 Memory` + `CD8 Memory`+
                     `CD8 Effector`+`Th cell`+`Monocytes CD16`+`Monocytes CD14`+DC+
                     pDC+Plasma, data =  data1)
  #summary(res.cox)

  multi_res <- summary(res.cox)
  res1 <- cbind(colnames(cell_new),multi_res[["coefficients"]][,c(2,5)])
  res2<-multi_res[["conf.int"]][,-2]

  HR <-round(res2[,1], digits=2);#exp(beta)
  HR.confint.lower <- round(res2[,2], 2)
  HR.confint.upper <- round(res2[,3],2)
  res1[,2] <- paste0(HR, " [",HR.confint.lower, "-", HR.confint.upper, "]")
  res1[,3]<-format(as.numeric(res1[,3]), scientific = TRUE, digits = 2)
  res1 <- rbind(c("Immune cells","HR 95% CI","P.value"),res1)

  res2<-data.table(rbind(c(NA,NA,NA),res2))
  colnames(res2)<-c("HR", "lower","upper")

  result<-list(res1,res2)
  return(result)
}

# 3、normalization归一化
# 这是将数据映射到(0,1)的归一化函数。
# 可以在http://r-pkgs.had.co.nz/了解有关使用RStudio编写软件包的更多信息。

normalization<-function(x) {
  min_v  <- min(x)
  max_v <- max(x)
  A<-x-replicate(dim(x)[2],min_v)
  B<-replicate(dim(x)[2],(max_v-min_v))
  return(A/B)
}

# 4、subtypes_DEA差异表达分析
subtypes_DEA <- function(Surv,seqd){
  ## 定义一个三模张量

  group<-factor(Surv$Subtype,c("1","2"),c("Subtype_1","Subtype_2"))
  design<-model.matrix(~0+group)
  colnames(design)<-c("Subtype_1","Subtype_2")
  #y <- cpm(seqd[,-1],log = TRUE)
  y <- voom(seqd[,-1], design, plot = F)
  fit <- lmFit(y, design)
  contr <- makeContrasts(Subtype_1-Subtype_2, levels = design)
  tmp <- contrasts.fit(fit, contr)
  tmp <- eBayes(tmp)
  res <- topTable(tmp, sort.by = "P", n = Inf)
  rownames(res)<-seqd$symbol[as.numeric(rownames(res))]

  T<-res[which(abs(res$logFC)>=1 & (res$adj.P.Val < 1e-2)),]
  if (dim(T)[1]<=20)
  {GS<-rownames(T)} else {
    T<-cbind(rownames(T),T)
    colnames(T)[1]<-c("Genes")
    res<-arrange(T,desc(abs(T$logFC)))
    GS<-as.character(res[1:20,1])
  }

  return(GS)
}

# 5、单因素cox
uni_cox<-function(covariates,data){

  univ_formulas <- sapply(covariates,
                          function(x) as.formula(paste('Surv(survival,death)~', x)))

  univ_models <- lapply( univ_formulas, function(x){coxph(x, data = data1)})

  univ_results <- lapply(univ_models,function(x){
    x <- summary(x)
    p.value<-format(x$wald["pvalue"], scientific = TRUE,digits = 3)
    #wald.test<-signif(x$wald["test"], digits=2)
    #beta<-signif(x$coef[1], digits=2);#coeficient beta
    HR <-round(x$coef[2], digits=2);#exp(beta)
    HR.confint.lower <- round(x$conf.int[,"lower .95"], 2)
    HR.confint.upper <- round(x$conf.int[,"upper .95"],2)
    HR1 <- paste0(HR, " [",HR.confint.lower, "-", HR.confint.upper, "]")
    res.cox<-c(HR, HR.confint.lower,HR.confint.upper,HR1,p.value)
    names(res.cox)<-c("HR", "lower","upper","HR [95% CI for HR]","p.value")
    return(res.cox)
    #return(exp(cbind(coef(x),confint(x))))
  })

  univ_res <- t(as.data.frame(univ_results, check.names = F))
  res1<-rbind(c("Immune cells","HR 95% CI","P.value"),
              cbind(colnames(cell_new),format(univ_res[,c(4,5)],scientific = TRUE,digits = 3)))
  res2<-data.table(rbind(c(NA,NA,NA),univ_res[,c(1,2,3)]))

  result<-list(res1,res2)
  return(result)
}


