数据集划分方法:KS算法和SPXY算法原理(附源论文及代码)
博主注:在进行近红外定量预测的研究中,发现网上现存关于KS和SPXY算法的公式有误,特查询了源头论文,进行更正和记录。若有疑问之处,欢迎大家一起交流!
目录
KS算法和SPXY算法之间的联系
Kennard-Stone(KS)算法原理
SPXY算法原理
SPXY官方源代码(Matlab)
KS算法和SPXY算法之间的联系
SPXY是基于KS算法提出的一种改进方法,KS对数据集的划分依据是计算不同样本的x向量方向(即常说的数据集的特征维度方向)的欧氏距离;而SPXY顾名思义,在此基础上增加了对不同样本的y向量方向(即常说的数据集的真实值维度方向)的欧氏距离的计算,并通过正则化将x和y方向的距离结合,更加全面的评估和划分数据集。
KS算法最初是为了创建实验设计的响应面而开发的:原论文链接:Kennard, R.W. and Stone, L.A. (1969) Computer-aided Design of Experiments. Technometrics, 11, 137-148. https://doi.org/10.1080/00401706.1969.10490666
对以上这篇论文的深入阅读可以跳过,因为流传较广的KS和SPXY的原理公式其实都来自提出SPXY算法的原论文(感兴趣的同学可以阅读一下):
Galvao R K H, Araujo M C U, José G E, et al. A method for calibration and validation subset partitioning[J]. Talanta, 2005, 67(4): 736-740.
论文将提出的SPXY与随机选择算法(RS)和KS算法进行比较,具体的研究案例是通过 NIR 光谱和 PLS 建模预测柴油的质量参数。
Kennard-Stone(KS)算法原理
算法选择过程:首先将 欧式距离dx(p, q)最大的样本对 (p, q) 选择进训练集。 在每次迭代中,选择相对于已选择的任意样本欧式距离最大和最小的样本进训练集。 重复这样的过程,直到达到指定的样本数量。
为了确保选择的数据集沿 x方向(特征维度)均匀分布,该算法计算每对 (p, q) 样本的 x 向量之间的欧几里德距离 dx(p, q):

文章针对NIR光谱数据,因此其中xp(j) 和 xq(j)分别是光谱样本第j个波长点对应的仪器相应值。
注意这里 J 是光谱样本的总波长数,N 是样本总数。
SPXY算法原理
相对于KS算法,增加样本的y方向距离dy(p, q):
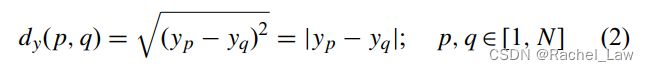
为了对x方向和y方向上的距离赋予同等的重要性,距离 dx(p, q) 和 dy(p,q) 同时除以它们在数据集中的最大值。 这样,归一化的 xy 距离dxy(p,q)计算为:

其选择过程与KS类似,将KS中的dx替换成dxy即可。
SPXY官方源代码(Matlab)
X 和 y 分别是特征矩阵(自变量)和真实值的列向量(因变量)。 Ncal 是要为训练集(校准集)选择的样本数。所选样本的索引下标在向量 m 中返回。
function m = spxy(X,y,Ncal)
dminmax = zeros(1,Ncal); % Inicializes the vector of minimum distances.
M = size(X,1); % Number of objects
samples = 1:M;
Dx = zeros(M,M); % Inicializes the matrix of X-distances.
Dy = zeros(M,M); % Inicializes the matriz de y-distances.
for i = 1:M-1
    xa = X(i,:);
    ya = y(i,:);
    for j = i + 1:M
        xb = X(j,:);
        yb = y(j,:);
        Dx(i, j) = norm(xa–xb);
        Dy(i, j) = norm(ya–yb);
    end
end
Dxmax = max(max(Dx));
Dymax = max(max(Dy));
D = Dx/Dxmax + Dy/Dymax; % Combines the X and y distances.
% D is an upper triangular matrix.
% D(i,j) is the distance between objects i and j (j > i).
[maxD,index row] = max(D);
% maxD is a row vector containing the largest element for each column of D.
% index row is the row in which the largest element of the column if found.
[dummy,index column] = max(maxD);
% index column is the column containing the largest element of matrix D.
m(1) = index row(index column);
m(2) = index column;
for i = 3:Ncal
    pool = setdiff(samples,m);
    % Pool is the index set of the samples that have not been selected yet.
    dmin = zeros(1,M − i + 1);
    % dmin will store the minimum distance of each sample in “pool” with respect to the
    % previously selected samples.
    for j = 1:(M − i + 1)
        indexa = pool(j);
        d = zeros(1,i-1);
        for k = 1:(i − 1)
            indexb = m(k);
            if indexa < indexb
                d(k) = D(indexa,indexb);
            else
                d(k) = D(indexb,indexa);
        end
      end
       dmin(j) = min(d);
    end
    % At each iteration, the sample with the largest dmin value is selected.
    [dummy,index] = max(dmin);
    m(i) = pool(index);
end