R语言进行Logistic回归分析
Logistic回归分析常常用来分析某个结局的危险因素或保护因素。
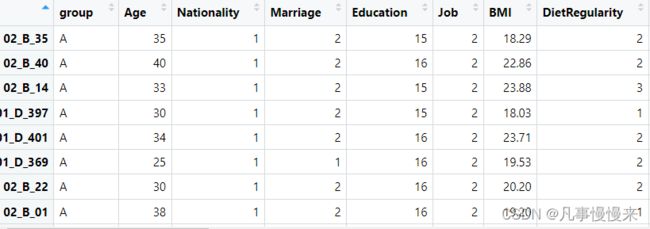
输入数据格式
分析代码
library(finalfit)
library(rstan)
library(boot)
library(tidyr)

meta$stress = ifelse(meta$IESR > 20, "stress", "health")#获取结局变量,为二分类的
meta$stress = as.factor(meta$stress)
meta$stress = relevel(meta$stress, ref = "health")


explanatory = c("group", "Age",  "BMI","PHQ9","DietRegularity")#指定危险因素或保护因素
dependent = 'stress'#指定结局变量

forest_df<- meta %>% #回归分析
  finalfit(dependent, explanatory, p=TRUE, column = TRUE) %>%
  rename(Univariate = "OR (univariable)")%>%
  separate(Univariate, into = c("OR (Univariate)", "p_value_u"), sep = ", TRUE")%>%
  separate(p_value_u, into = c("p_value_uni", "x1"), sep = "\\)")%>%
  rename(Multivariable = "OR (multivariable)")%>%
  separate(Multivariable, into = c("OR (Multivariable)", "p_value_m"), sep = ", TRUE")%>%
  separate(p_value_m, into = c("p_value_multi", "x2"), sep = "\\)")%>%
  dplyr::select(-x1, -x2)%>%
  replace_na(list(p_value_uni = "-", p_value_multi = "-")) %>%
  dplyr::select(`Dependent: stress`, `OR (Multivariable)`,  p_value_multi)%>%
  separate(`OR (Multivariable)`, into = c("Estimate", "lowerlimit", "p"), sep = " ")%>%
  dplyr::select(-p)%>%
  separate(lowerlimit, into = c("first", "last"), sep = 1)%>%
  dplyr::select(-first)%>%
  separate(last, into = c("first", "last"), sep = -1)%>%
  dplyr::select(-last)%>%
  separate(first, into = c("lowerlimit", "upperlimit"), sep = "\\-")%>%
  separate(p_value_multi, into = c("first", "p_value"), sep = 1)%>%
  dplyr::select(-first)%>%
  mutate(sig = ifelse(p_value < 0.05 , "Sig", "Non-Sig"))

forest_df2 <-forest_df %>%
  filter(Estimate != "-")%>%
  dplyr::rename(Factor = `Dependent: stress`)%>%
  arrange(desc(Factor))
forest_df2 = forest_df2[1:3, ]


forest_df2$Estimate <- as.numeric(forest_df2$Estimate)
forest_df2$lowerlimit <- as.numeric(forest_df2$lowerlimit)
forest_df2$upperlimit <- as.numeric(forest_df2$upperlimit)

fig <- ggplot(forest_df2, aes(x=Factor, y=Estimate, ymin=lowerlimit, ymax=upperlimit))+
  geom_pointrange(position = position_dodge(width = 0.60))+
  geom_hline(yintercept = 1, linetype=2)+
  coord_flip()+
  xlab('')+
  scale_y_log10()+
  ylab("Adjusted OR (95% CI)")+
  geom_errorbar(aes(ymin = lowerlimit, ymax = upperlimit),width=0.1, position = position_dodge(width = 0.60))+
  theme(plot.title = element_text(hjust = 0.5))+
  theme_minimal()+
  theme(axis.text.y= element_text(size=12))

fig
输出结果
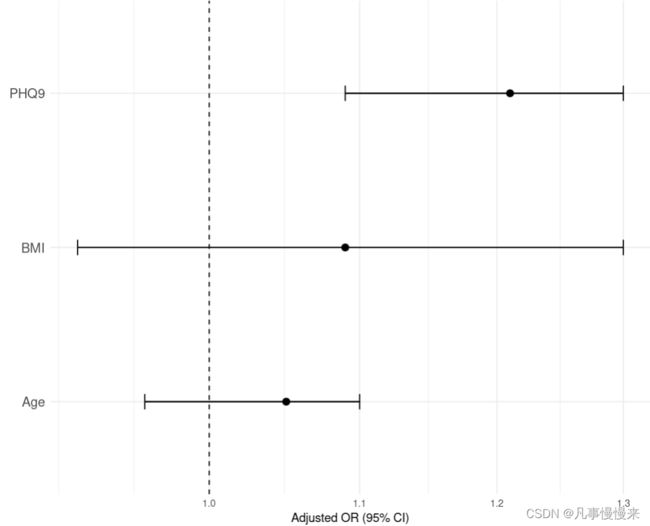
注:PHQ9是抑郁评分,可以看到抑郁是应激的危险因素。