matplolib函数总结
matplotlib
绘图函数
plot
plot : 绘制二维图形 , 将平面的点连接起来
import numpy as np
import matplotlib.pyplot as plt

x = np.linspace(-np.pi, np.pi, 256,endpoint=True)
plt.plot(x,np.cos(x)) # x轴 y轴
plt.show() # 最后输入这个
# 不指定x轴则会为0,1,2...n-1
scatter
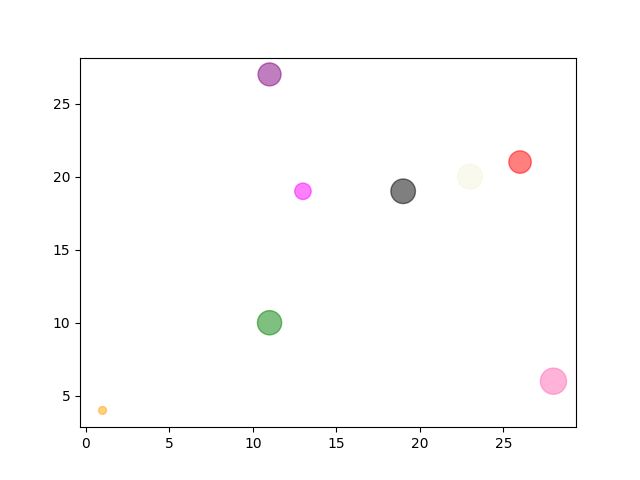
scatter : 绘制散点图
x = np.random.randint(1,30,(1,8))
y = np.random.randint(1,30,(1,8))
Size = np.random.randint(10,500,(1,8))
Color = np.array(["red","green","black","orange","purple","beige","hotpink","magenta"])
# 颜色可以用RGB代码表示
# 类似于聚类的图可以画两次,每一次换一个颜色
plt.scatter(x,y,s=Size,c=Color,alpha=0.5) # alpha 是透明度,设置了要好看一点
plt.show()
x = np.random.randint(1,100,(1,300))
y = np.random.randint(1,100,(1,300))
y.sort() # 先排个序,也可以不排
colors = np.arange(300) # 个数必须和上面对应,可以自己设置颜色,可以理解为最后归一化决定颜色

plt.scatter(x, y, c=colors, cmap='viridis') # camp是颜色条名字
plt.colorbar() # 显示色条
plt.show()
可选参数 更多颜色
| cool | winter | viridis | rainbow | twilight | terrain | spring |
|---|---|---|---|---|---|---|
| prism | plasma | pink | ocean | jet | flag | Blues |
bar , barh
bar : 画柱状图
barh : 横着的柱状图 , 用法和bar相同
x = np.array(['col-1','col-2','col-3','col-4'])
y = np.array([3,8,5,9])
Color = np.array(['red','blue','green','hotpink'])
plt.bar(x,y,color=Color,width=0.9) # width 是[0,1]
# 如果是barh就是height
plt.show()
pie
pie : 绘制饼图
| 参数 | 说明 | 取值 |
|---|---|---|
| x | 每个扇形的值 | 列表 |
| lables | 每个扇形的名字 | 列表 |
| explod | 每个扇形的间隔 | 列表 , 代表每一个扇形与其他扇形的距离 (0.1合适) |
| colors | 颜色 | 列表 , 扇区的颜色 |
| autopct | 扇形显示百分比 | 整数’%d%%’ , 小数’%0.1f’ , 小数百分比’%0.1f%%’ |
| labeldistance | 标签距离扇形的距离 | 默认1.1 , 小于1就在扇形里面 |
| pctdistance | 扇形百分比的位置 | 默认0.6 |
y = np.array([35, 25, 25, 15])
plt.pie(y,
        labels=['A','B','C','D'],
        colors=["red", "lightblue", "green", "hotpink"],
        explode=[0.1,0,0,0],
        autopct='%d%%',
       )
plt.show()
图像参数和标注
figure
figure : 调整画的图片的尺寸
plt.figure(figsize=(8,5),dpi=80)
legend
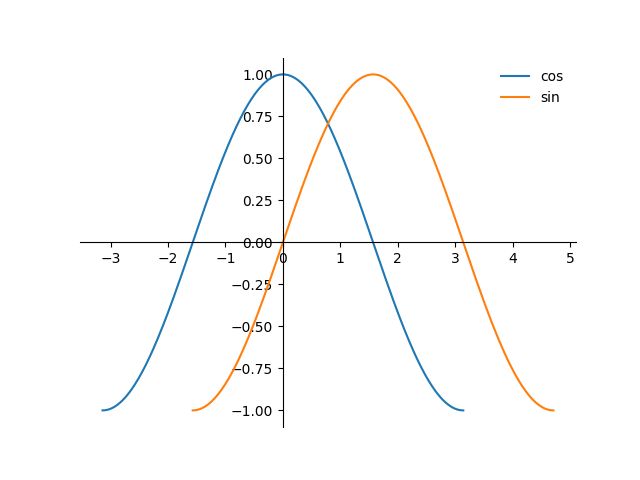
legend : 在一图多函数的时候 , 可以对每一个函数进行标注名字
plot(x1,y1,label='cos') # 画图标记名字
plot(x2,y2,label='sin')
plt.legend(loc='upper left',frameon = False)
# 标记地方,和是否需要一个小边框
import matplotlib.pyplot as plt
import numpy as np

ax = plt.subplot()
ax.spines['right'].set_color('none')
ax.spines['top'].set_color('none')
ax.spines['bottom'].set_position(('data',0))
ax.spines['left'].set_position(('data',0))

x1 = np.linspace(-np.pi,np.pi,300)
x2 = np.linspace(-np.pi/2,np.pi*3/2,300)
y1 = np.cos(x1)
y2 = np.sin(x2)

plt.plot(x1,y1,label="cos")
plt.plot(x2,y2,label='sin')
plt.legend(loc='best',frameon = False)
plt.show()
位置是以下几个词语的排列组合 (left , right放在最后)
| best | right | lower |
|---|---|---|
| center | left | upper |
annotate
annotate : 在图像上标注点
# latex 的标注内容
# xy:标注点的位置
# xytext:注解内容位置坐标
# fontsize:字体大小
# xycoords,textcoords,arrowprops 基本上不用调整
pointx,pointy = 1,2
plt.plot([pointx,pointx],[0,pointy],linestyle="--")
plt.scatter([pointx],[pointy], 50,)
# 顺便添加一个辅助线,z
plt.annotate(r'$this point$',
             xy=(pointx,pointy),
             xytext=(-90, -50),
             xycoords='data',
             textcoords='offset points',
             fontsize=16,
             arrowprops=dict(arrowstyle="->", connectionstyle="arc3,rad=.2")
            )
线条参数
| 颜色 | 字符 | 线型 | 字符 | 标记 | 字符 |
|---|---|---|---|---|---|
| 蓝色 | b | 实线 | - | 点标记 | . |
| 红色 | r | 破折线 | – | 像素标记 | , |
| 黄色 | y | 点划线 | -. | 实心圈 | o |
| 黑色 | k | 虚线 | : | 倒三角 | v |
| 绿色 | g | 上三角 | ^ | ||
| 白色 | w | 星星 | * |
更多形状参见绘图标记 绘图线
坐标轴
spines
spines : 设置坐标轴的相关参数
ax = plt.subplot()
ax.spines['right'].set_color('none')
ax.spines['top'].set_color('none')
ax.spines['bottom'].set_position(('data',0))
ax.spines['left'].set_position(('data',0))
xticks , yticks
xticks : 设置x轴显示的数字
yticks : 设置y轴显示的数字
x = np.linspace(-np.pi, np.pi, 256,endpoint=True)
plt.plot(x,np.cos(x))
plt.xticks(np.linspace(-np.pi,np.pi,9))
plt.yticks(np.linspace(-2,2,9))
plt.show()
还支持latex , 一个一个对应的方式
x = np.linspace(-np.pi, np.pi, 256,endpoint=True)
plt.plot(x,np.cos(x))
plt.xticks([-np.pi, -np.pi/2, 0, np.pi/2, np.pi],['$-\pi$','$-\pi/2$','$0$','$+\pi/2$','$+\pi$'])
plt.show()
防止遮挡xy轴的数字
for label in ax.get_xticklabels() + ax.get_yticklabels():
    label.set_fontsize(16)
    label.set_bbox(dict(facecolor='white', edgecolor='None', alpha=0.65 ))
但是使用之前要先设置plot里面的 zorder ,也就是遮挡优先级 ,还需要用subplot生成一个 ax
ax = plt.subplot(111)
ax.spines['right'].set_color('none')
ax.spines['top'].set_color('none')
ax.spines['bottom'].set_position(('data',0))
ax.spines['left'].set_position(('data',0))

X = np.linspace(-np.pi, np.pi, 256,endpoint=True)
C,S = np.cos(X), np.sin(X)

plt.plot(X, C,zorder=-1)
plt.plot(X, S,zorder=-2)

for label in ax.get_xticklabels() + ax.get_yticklabels():
    label.set_fontsize(16)
    label.set_bbox(dict(facecolor='white', edgecolor='None', alpha=0.65 ))
plt.show()
xlim , ylim
xlim : 设置x轴上下限
ylim : 设置y轴上下限
plt.xlim(x.min()*1.1,x.max()*1.1) # 1.1是默认值
# 下限 上限
# ylim同理
中文设置
方法一
字体下载 [yxqu]
本地路径 “C:\chinese.otf”
这种方法不会改变全局字体
chinese = matplotlib.font_manager.FontProperties(fname="C:\\chinese.otf")
# 设置路径
plt.title("余弦函数",fontproperties=chinese) # 使用方法
plt.xlabel("x轴",fontproperties=chinese)
方法二
这种方法会改变全局字体 , 就都可以使用中文了
plt.rcParams['font.sans-serif']=['SimHei']
| 宋体 | 黑体 | 微软雅黑 | 新宋体 | 楷体 |
|---|---|---|---|---|
| SimSun | SimHei | Microsoft YaHei | NSimSun | KaiTi |
标签
xlable , ylable
xlable : x轴标签
ylable : y轴标签
可以添加 fontdict , size , loc 参数
plt.xlabel("x轴", fontproperties=zhfont1,fontdict={'color':'red'},size=10)
plt.ylabel("y")
title
title : 加上一个标题
plt.title("x-cos(x)") # 可以添加size参数显得标题大一点
利用 title , xlable , ylable 的 loc 位置参数
| 函数 | 参数 | 参数 | 默认参数 |
|---|---|---|---|
| xlable | left | right | center |
| ylable | bottom | top | center |
| title | left | right | center |
plt.xlable("x_lable",loc="left")
网格线
grid
grid : 添加一个网格线 , 具体参数可以看 “线条参数”
plt.grid(color = 'r', linestyle = '--', linewidth = 0.5,axis = 'x')
多图绘制
subplot
subplot : 划分区域画图
subplot(1,2,1) # 1*2的subplot 编号1
# ....plot....
subplot(1,2,2) # 1*2的subplot 编号2
# ....plot....
suptitle
suptitle : 给多图绘制一个大标题
plt.suptitle("subplot Test")
subplots
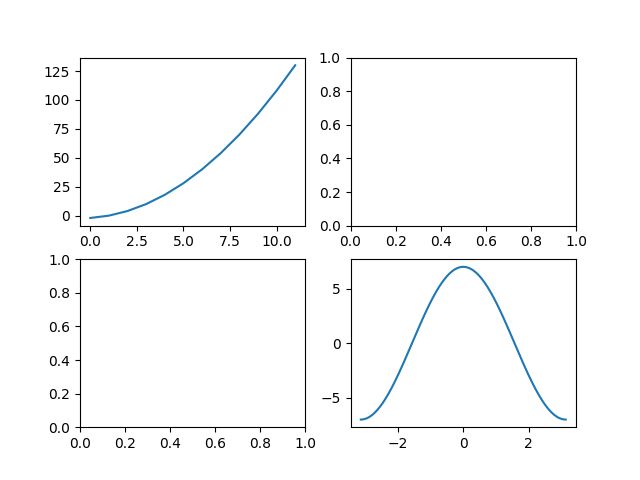
subplots : 绘制多个图形 , 相比subplot功能更多
import matplotlib.pyplot as plt
import numpy as np

x1 = np.arange(12)
y1 = x1**2+x1-2
x2 = np.linspace(-np.pi,np.pi,256)
y2 = 7*np.cos(x2)

[fig,area] = plt.subplots(2,2)
area[0,0].plot(x1,y1)
area[1,1].plot(x2,y2)
plt.show()
plt.subplots(2, 2, sharey='all') # 共享y轴
plt.subplots(2, 2, sharex='all') # 共享x轴
# 两个都共享效果不太好
参考资料
matplotlib官网
更多绘图函数
examples
菜鸟教程1
菜鸟教程2


