python绘图设置标题,如何隐藏绘图yaxis标题(在Python中)?
Editing:
The following example from Plotly for reference:
import plotly.express as px
df = px.data.gapminder().query("continent == 'Europe' and year == 2007 and pop > 2.e6")
fig = px.bar(df, y='pop', x='country', text='pop')
fig.update_traces(texttemplate='%{text:.2s}', textposition='outside')
fig.update_layout(uniformtext_minsize=8, uniformtext_mode='hide')
fig.show()
How to remove the word 'pop'.
What I want to hide the y-axis title of'value'.
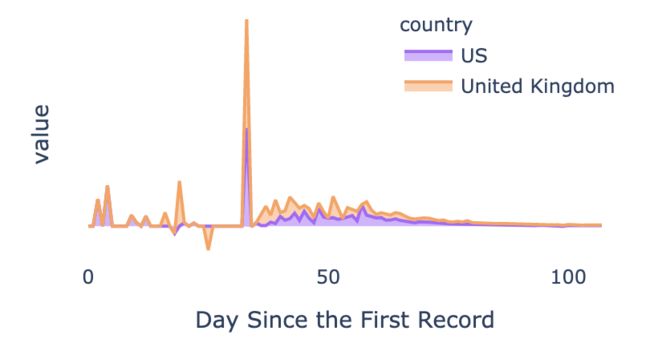
The following syntax doesn't work.
fig.update_yaxes(showticklabels=False)
Thanks.
解决方案
Solution
You need to use visible=False inside fig.update_yaxes() or fig.update_layout() as follows. For more details see the documentation for plotly.graph_objects.Figure.
# Option-1: using fig.update_yaxes()
fig.update_yaxes(visible=False, showticklabels=False)
# Option-2: using fig.update_layout()
fig.update_layout(yaxis={'visible': False, 'showticklabels': False})
# Option-3: using fig.update_layout() + dict-flattening shorthand
fig.update_layout(yaxis_visible=False, yaxis_showticklabels=False)
Try doing the following to test this:
# Set the visibility ON
fig.update_yaxes(title='y', visible=True, showticklabels=False)
# Set the visibility OFF
fig.update_yaxes(title='y', visible=False, showticklabels=False)
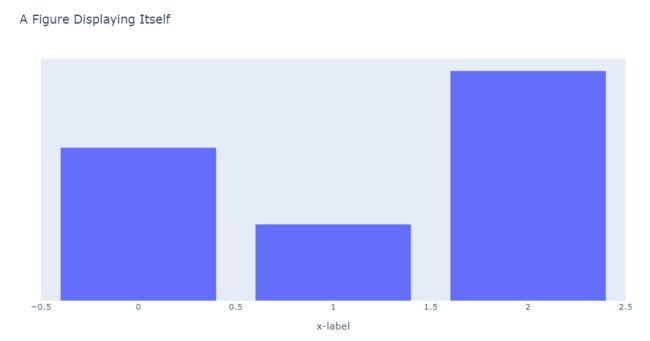
How to create the figure directly with hidden-yaxis label and tickmarks
You can do this directly by using the layout keyword and supplying a dict to go.Figure() constructor.
import plotly.graph_objects as go
fig = go.Figure(
data=[go.Bar(y=[2, 1, 3])],
layout_title_text="A Figure Displaying Itself",
layout = {'xaxis': {'title': 'x-label',
'visible': True,
'showticklabels': True},
'yaxis': {'title': 'y-label',
'visible': False,
'showticklabels': False}
}
)
fig
An Interesting Feature of Plotly: A hidden shorthand
It turns out that Plotly has a convenient shorthand notation allowing dict-flattening available for input arguments such as this:
## ALL THREE METHODS BELOW ARE EQUIVALENT
# No dict-flattening
# layout = dict with yaxis as key
layout = {'yaxis': {'title': 'y-label',
'visible': False,
'showticklabels': False}
}
# Partial dict-flattening
# layout_yaxis = dict with key-names
# title, visible, showticklabels
layout_yaxis = {'title': 'y-label',
'visible': False,
'showticklabels': False}
# Complete dict-flattening
# layout_yaxis_key-name for each of the key-names
layout_yaxis_title = 'y-label'
layout_yaxis_visible = False
layout_yaxis_showticklabels = False
Now try running all three of the following and compare the outputs.
import plotly.graph_objects as go
# Method-1: Shortest (less detailed)
fig = go.Figure(
data=[go.Bar(y=[2, 1, 3])],
layout_title_text="A Figure Displaying Itself",
layout_yaxis_visible = False,
layout_xaxis_title = 'x-label'
)
fig.show()
# Method-2: A hibrid of dicts and underscore-separated-syntax
fig = go.Figure(
data=[go.Bar(y=[2, 1, 3])],
layout_title_text="A Figure Displaying Itself",
layout_xaxis_title = 'x-label',
layout_yaxis = {'title': 'y-label',
'visible': False,
'showticklabels': False}
)
fig.show()
# Method-3: A complete dict syntax
fig = go.Figure(
data=[go.Bar(y=[2, 1, 3])],
layout_title_text="A Figure Displaying Itself",
layout = {'xaxis': {'title': 'x-label',
'visible': True,
'showticklabels': True},
'yaxis': {'title': 'y-label',
'visible': False,
'showticklabels': False}
}
)
fig.show()