(三)描述性统计分析与绘图
描述性统计分析与绘图
- 1 描述性统计分析
-
- 1.1 概念
- 1.2 描述统计/案例
-
- 1.2.1 单因子频数
- 1.2.2 表分析
- 1.2.3 单连续变量描述
- 1.2.4 分类汇总
- 1.2.5 汇总表
- 1.2.5 时间序列——双轴图
- 2 绘图原理
- 3 案例
1 描述性统计分析
1.1 概念
- 数据变量度量类型
名义: 字符(原义)、数值(编码)
等级 :字符、数值 有排序 ‘小中大’ 差值无意义
连续 :数值 ‘age’
#连续变量分组,当成等级变量使用,可使数据更稳健
#名义变量和等级变量统称为分类变量。
统计量:频次、百分比
- 描述名义变量的分布
频次、百分比
#python所用包都不支持字符,需要编码,0/1(关注的量编为1)
- 描述连续变量的分布
标准差Standard Deviation:

四分位差IQR:上分位数-下分位数
- 偏度(形状):正态不偏skewness=0、右偏skewness正值
- 常见连续分布
1)对数正态分布 :运用广泛,收入的分布,右偏
描述性统计分析:取中位数
建模:取对数
2)伽玛分布:灾难造成损失金额
3)泊松分布:队伍长度
4)正态分布:自然界分布,均值代表中心水平
1.2 描述统计/案例
导入所需的包
import pandas as pd
import numpy as np
import matplotlib.pyplot as plt
import matplotlib
import seaborn as sns
import os                #os:Operating System操作系统
读取数据
os.chdir(r'D:\python商业实践\《Python数据科学技术详解与商业实践》PDF+源代码+八大案例\《Python数据科学技术详解与商业实践》PDF+源代码+八大案例\源代码\Python_book\4Describe')
snd=pd.read_csv("sndHsPr.csv")
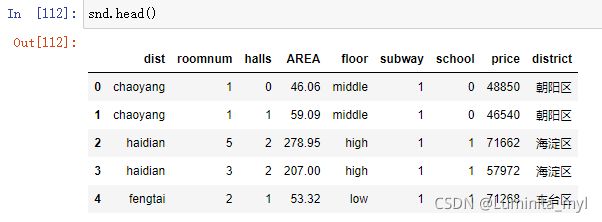
snd.head()
district={'fengtai':'丰台区','haidian':'海淀区','chaoyang':'朝阳区','dongcheng':'东城区','shijingshan':'石景山区','xicheng':'西城区'}
snd['district']=snd.dist.map(district)在这里插入代码片
1.2.1 单因子频数
一个分类变量
value_counts() 每个数值的频次
snd.district.value_counts()
- 绘制柱状图
.plot(kind='bar')
snd.district.value_counts().plot(kind='bar')
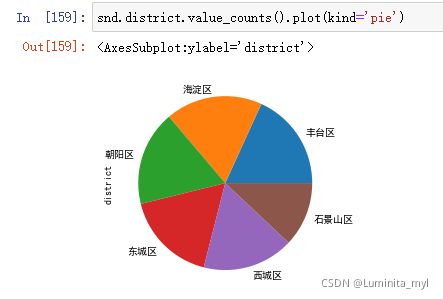
- 绘制饼状图
kind='pie'
snd.district.value_counts().plot(kind='pie')
1.2.2 表分析
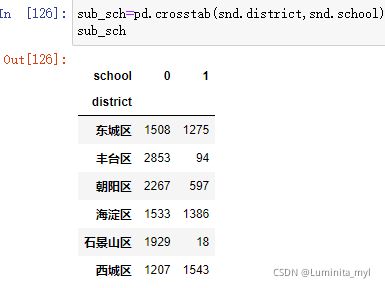
两个分类变量
pd.crosstab(分类变量1,分类变量2)
生成数据框,频次表
sub_sch=pd.crosstab(snd.district,snd.school)
sub_sch
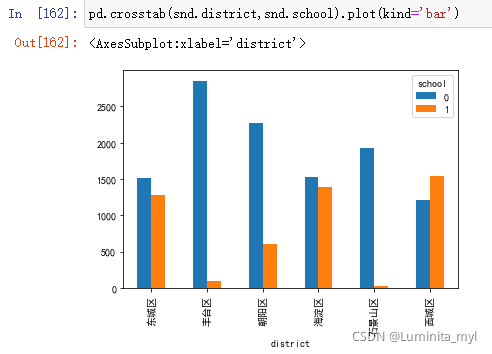
- 分类柱形图
pd.crosstab(snd.district,snd.school).plot(kind='bar')
- 堆叠柱形图,可以看出资源分配
t1=pd.crosstab(snd.district,snd.school)
t1.plot(kind='bar',stacked=True)
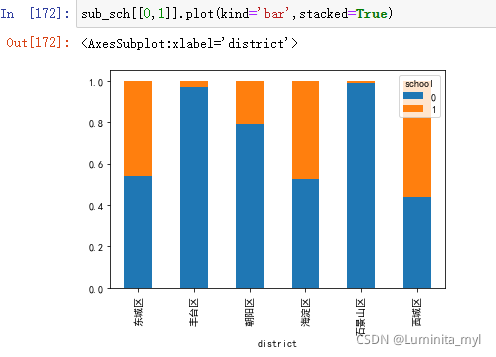
- 标准化堆叠柱形图
用于比较两个分类变量是否有关系 ,直观,明显看出资源分配
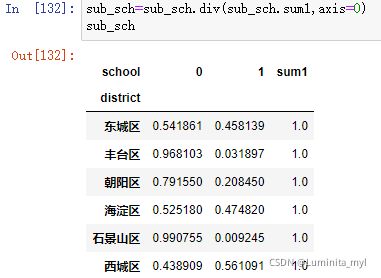
sub_sch=pd.crosstab(snd.district,snd.school)
sub_sch['sum1']=sub_sch.sum(1)                  #1代表列,汇总出一列
sub_sch.head()
sub_sch=sub_sch.div(sub_sch.sum1,axis=0)    #按行求百分比
sub_sch
sub_sch[[0,1]].plot(kind='bar',stacked=True)
- 两个维度标准化的堆积柱状图,柱形的宽度代表数量,更直观。
def stack2dim (raw,i,j,rotation=0,location='upper right'):
raw:pandas的DataFrame数据框
i、j:两个分类变量名称,横纵轴名称
rotation:水平标签旋转角度,默认水平方向,若标签过长,可设置一定角度,如rotation=40
location:分类标签位置,如果被主题图形挡住,可更改为‘upper left’
需要调用函数*
from stack2dim import *
stack2dim(snd, i="district", j="school")
1.2.3 单连续变量描述
snd.price.agg(['mean','median','sum','std','skew']) #得多个统计量
snd.price.hist(bins=100) #bins为分组数
snd.price.mean()     #均值
snd.price.median()   #中位数
snd.price.std()      #标准差
snd.price.skew()     #偏度
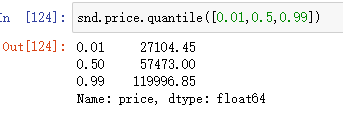
snd.price.quantile([0.01,0.5,0.99]) #取分位点
1.2.4 分类汇总
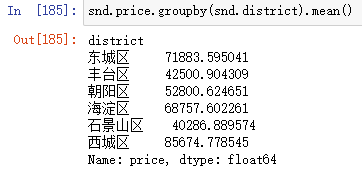
一个分类变量、一个连续变量统计量
groupby() 分类汇总
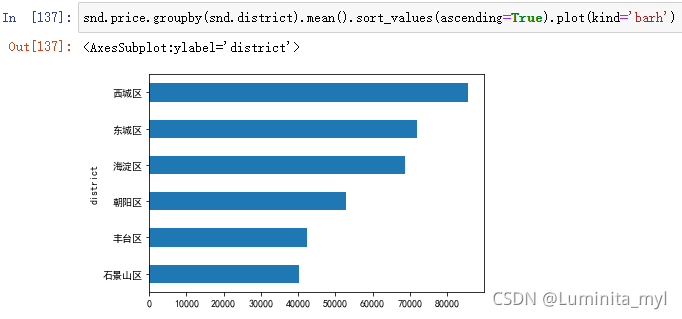
snd.price.groupby(snd.district).mean() #取连续变量的均值,可替换
- 柱形图
snd.price.groupby(snd.district).mean().plot(kind='bar')
sns.boxplot(x='district',y='price',data=snd)
1.2.5 汇总表
两个分类变量(分别在x、y轴)、一个连续变量统计量
pivot_table()
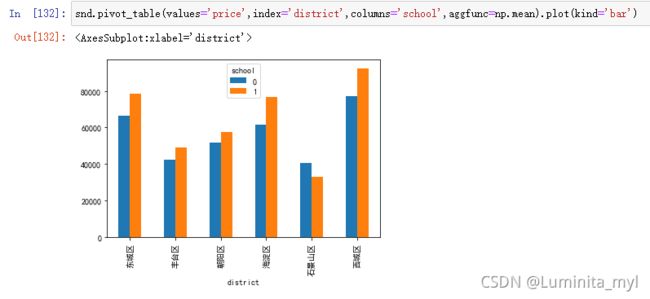
snd.pivot_table(values='price',index='district',columns='school',aggfunc=np.mean) #mean是numpy的函数 np.mean
snd.pivot_table(values='price',index='district',columns='school',aggfunc=np.mean).plot(kind='bar')
1.2.5 时间序列——双轴图
按年度汇总GDP,计算GDP增长率。GDP为柱子,GDP增长率为线
导入gdp数据
gdp=pd.read_csv('gdp_gdpcr.csv',encoding='gbk')
x=list(gdp.year)
GDP=list(gdp.GDP)
GDPCR=list(gdp.GDPCR)
fig=plt.figure()                           #设置绘图区域

ax1=fig.add_subplot(111)
ax1.bar(x,GDP)                             #主轴表示GDP
ax1.set_ylabel('GDP')                      #设置主轴标题
ax1.set_title("GDP of China(2000-2017)")   #设置图标题
ax1.set_xlim(2000,2018)                    #设置横坐标数值范围

ax2=ax1.twinx()                            #拷贝的副轴
ax2.plot(x,GDPCR,'r')                      #‘r’表示为红色red
ax2.set_ylabel('Increase Ratio')
ax2.set_xlabel('Year')
附:
若横坐标乱码,显示出方块,可能原因是默认字体不能打印汉字,修改字体加入以下代码
from pylab import mpl
mpl.rcParams['font.sans-serif']=['SimHei']    #指定默认字体 SimHei表示简体中文
mpl.rcParams['axes.unicode_minus']=False      #解决横坐标显示方块的问题
snd.district.value_counts().plot(kind='bar')
2 绘图原理
数据->信息->相对关系->图像
表达关联性的图标
一个分类一个连续:盒须图
多分类:堆叠柱形图
两个连续变量:散点图
3 案例
import pandas as pd
import numpy as np
import os
import matplotlib.pyplot as plt
import matplotlib
import seaborn as sns
os.chdir(r'D:\python商业实践\《Python数据科学技术详解与商业实践》PDF+源代码+八大案例\《Python数据科学技术详解与商业实践》PDF+源代码+八大案例\源代码\Python_book\4Describe')
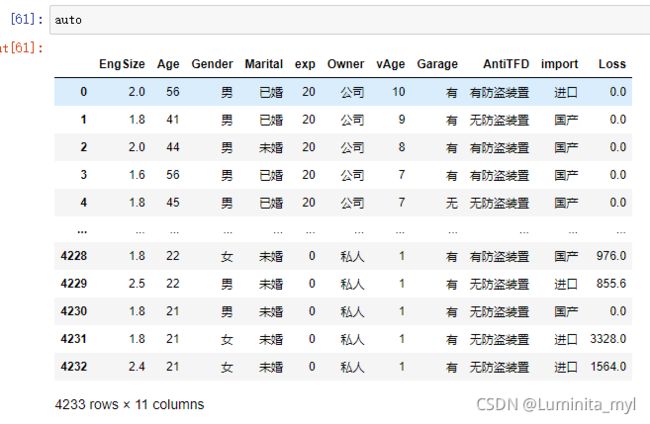
auto=pd.read_csv('auto_ins.csv',encoding='gbk')
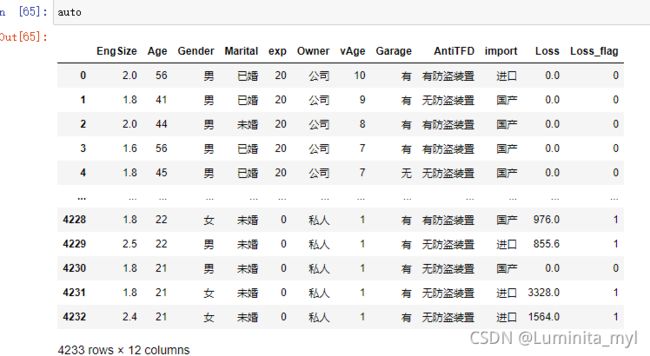
- 对Loss重新编码1/0,有数值命名为1,命名为Loss_flag
def codeMy(x):
    if x>0:
        return 1
    else:
        return 0
auto['Loss_flag']=auto.Loss.map(codeMy)  #map:codeMy返回的数值分别对应Loss进行替换
#######################令
auto['Loss_flag']=auto.Loss.map(lambda x:1 if x>0 else 0)
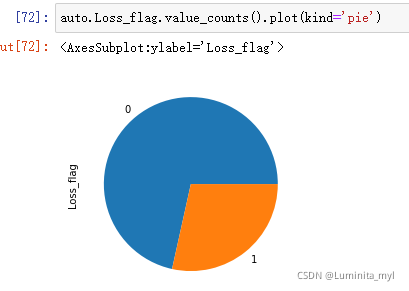
- 对Loss_flag的分布进行分析
分类变量—>频次分布
value_counts()
查看百分比
auto.Loss_flag.value_counts()/auto.Loss_flag.count()
auto.Loss_flag.value_counts().plot(kind='pie')
- 分析出险和年龄、驾龄、性别、婚姻状况等变量之间的关系
年龄、驾龄—>一个分类变量、一个连续变量 —>盒须图
fig=plt.figure()
ax1=fig.add_subplot(1,2,1)
ax2=fig.add_subplot(1,2,2)
sns.boxplot(x='Loss_flag',y='Age',data=auto,ax=ax1)
sns.boxplot(x='Loss_flag',y='exp',data=auto,ax=ax2)
可以看出出险与年龄无关,与驾龄有关

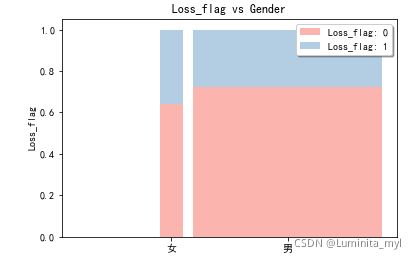
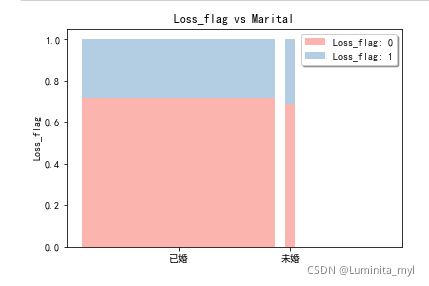
性别、婚姻状况—>两个分类变量的关系 —>标准化了的堆叠柱形图,宽度代表样本量
from stack2dim import *
stack2dim(auto,'Gender','Loss_flag')
from stack2dim import *
stack2dim(auto,'Marital','Loss_flag')


