【3】机器学习中高斯混合模型的求解
【1】机器学习中的函数GaussianMixture求解各个模型的分量
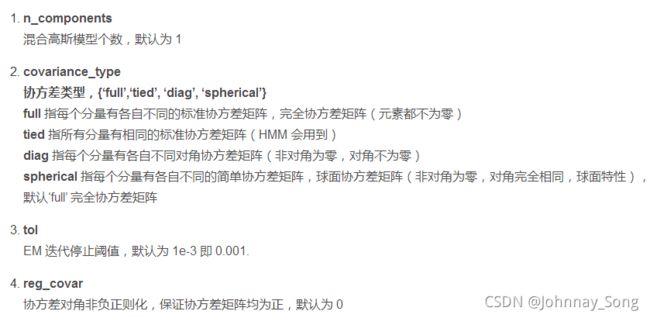
【1.1】GaussianMixture参数解释
可参考文献:【sklearn篇】mixture.GaussianMixture各参数详解以及代码实现_Yakuho的博客-CSDN博客_gaussianmixture
【1.2】单个高斯模型求解
from matplotlib import colors
import numpy as np
import matplotlib.pyplot as plt
from numpy.lib.twodim_base import diag
from sklearn.mixture import GaussianMixture

import numpy as np
import matplotlib.pyplot as plt

#均值
def average(data):
    return np.sum(data)/len(data)
#标准差
def sigma(data,avg):
    sigma_squ=np.sum(np.power((data-avg),2))/len(data)
    return np.power(sigma_squ,0.5)
#高斯分布概率
def prob(data,avg,sig):
    print(data)
    sqrt_2pi=np.power(2*np.pi,0.5)
    coef=1/(sqrt_2pi*sig)
    powercoef=-1/(2*np.power(sig,2))
    mypow=powercoef*(np.power((data-avg),2))
    return coef*(np.exp(mypow))
#样本数据
data=np.array([0.79,0.78,0.8,0.79,0.77,0.81,0.74,0.85,0.8
               ,0.77,0.81,0.85,0.85,0.83,0.83,0.8,0.83,0.71,0.76,0.8])
#根据样本数据求高斯分布的平均数
ave=average(data)
#根据样本求高斯分布的标准差
sig=sigma(data,ave)
#拿到数据
x=np.arange(0.5,1.0,0.01)
print("原始数据计算得到的结果!")
print("均值:  ",ave)
print("标准差:",sig)
# p=prob(x,ave,sig)
# plt.plot(x,p)
# plt.grid()
# plt.xlabel("apple quality factor")
# plt.ylabel("prob density")
# plt.yticks(np.arange(0,12,1))
# plt.title("Gaussian distrbution")
# plt.show()

#调用机器学习中的GaussianMixture混合函数求解方法得到的结果
'''
full 指每个分量有各自不同的标准协方差矩阵,完全协方差矩阵(元素都不为零)
tied 指所有分量有相同的标准协方差矩阵(HMM 会用到)
diag 指每个分量有各自不同对角协方差矩阵(非对角为零,对角不为零)
spherical 指每个分量有各自不同的简单协方差矩阵,球面协方差矩阵(非对角为零,对角完全相同,球面特性),默认‘full’ 完全协方差矩阵
'''
gmm=GaussianMixture(n_components=1,covariance_type="diag",max_iter=100)
dataall=np.array(data,np.newaxis).reshape(-1,1)
gmm.fit(dataall)
print("调用机器学习中的GaussianMixture混合函数求解方法得到的结果!")
print("权重:  ",gmm.weights_)
print("均值:  ",gmm.means_ )
print("协方差:",gmm.covariances_)
运行结果
结果分析:
(1)单个高斯模型发现采用GaussianMixture拟合的结果和原始数据计算的结果是一致的;
(2)由协方差的定义可知,变量对自己的协方差就是标准差的平方,所以0.0013=0.036*0.036.
(3) GaussianMixture的结果无法获得单个模型的标准差,只能获取协方差。通过设置类型可以计算单个变量的标准差。
full 指每个分量有各自不同的标准协方差矩阵,完全协方差矩阵(元素都不为零)
tied 指所有分量有相同的标准协方差矩阵(HMM 会用到)
diag 指每个分量有各自不同对角协方差矩阵(非对角为零,对角不为零)
spherical 指每个分量有各自不同的简单协方差矩阵,球面协方差矩阵(非对角为零,对角完全相同,球面特性)
【1.3】混合GMM模型求解
生成三个高斯混合模型,然后调用GaussianMixture求解权重、方差、协方差。
import numpy as np
import matplotlib.pyplot as plt
from gmm_em import gmm_em
from gmm_em import gaussian
from sklearn.neighbors import KernelDensity
from sklearn.mixture import GaussianMixture

D = 1 # 2d data
K = 3 # 3 mixtures

#1:
n1 = 70
mu1 = [0]
sigma2_1 = [[0.3]]
#2:
n2 = 150
mu2 = [2]
sigma2_2  = [[0.2]]
#3:
n3 = 100
mu3 = [4]
sigma2_3  = [[0.3]]

N = n1 + n2 + n3
alpha1 = n1/N
alpha2 = n2/N
alpha3 = n3/N


sample1 = np.random.multivariate_normal(mean=mu1, cov=sigma2_1, size=n1)
sample2 = np.random.multivariate_normal(mean=mu2, cov=sigma2_2, size=n2)
sample3 = np.random.multivariate_normal(mean=mu3, cov=sigma2_3, size=n3)


#计算原始数据的均值、方差
all_data=[sample1,sample2,sample3]
real_mean=[]
real_sigma=[]
for data in all_data:
    mean=np.sum(data)/len(data)
    real_mean.append(mean)
for index, data in enumerate(all_data) :
    sigma_squ=np.sum(np.power((data-real_mean[index]),2))/len(data)
    sigma=np.power(sigma_squ,0.5)
    real_sigma.append(sigma)
print("原始数据均值:",real_mean)
print("原始数据方差:",real_sigma)
Y = np.concatenate((sample1, sample2, sample3),axis=0)
Y_plot = np.linspace(-2, 6, 1000)[:, np.newaxis]
true_dens = (alpha1 * gaussian(Y_plot[:, 0], mu1, sigma2_1)
             + alpha2 * gaussian(Y_plot[:, 0], mu2, sigma2_2)
             + alpha2 * gaussian(Y_plot[:, 0], mu3, sigma2_3))

fig, ax = plt.subplots()
ax.fill(Y_plot[:, 0], true_dens, fc='black', alpha=0.2, label='true distribution')
ax.plot(sample1[:, 0], -0.005 - 0.01 * np.random.random(sample1.shape[0]), 'b+', label="input class1")
ax.plot(sample2[:, 0], -0.005 - 0.01 * np.random.random(sample2.shape[0]), 'r+', label="input class2")
ax.plot(sample3[:, 0], -0.005 - 0.01 * np.random.random(sample3.shape[0]), 'g+', label="input class3")

kernel = 'gaussian'
kde = KernelDensity(kernel=kernel, bandwidth=0.5).fit(Y)
log_dens = kde.score_samples(Y_plot)
ax.plot(Y_plot[:, 0], np.exp(log_dens), '-', label="input distribution".format(kernel))

ax.set_xlim(-2, 6)

# plt.show()

omega, alpha, mu, cov = gmm_em(Y, K, 100)

category = omega.argmax(axis=1).flatten().tolist()
class1 = np.array([Y[i] for i in range(N) if category[i] == 0])
class2 = np.array([Y[i] for i in range(N) if category[i] == 1])
class3 = np.array([Y[i] for i in range(N) if category[i] == 2])

est_dens = (alpha[0] * gaussian(Y_plot[:, 0], mu[0], cov[0])
             + alpha[1] * gaussian(Y_plot[:, 0], mu[1], cov[1])
             + alpha[2] * gaussian(Y_plot[:, 0], mu[2], cov[2]))

ax.fill(Y_plot[:, 0], est_dens, fc='blue', alpha=0.2, label='estimated distribution')
ax.plot(class1[:, 0], -0.03 - 0.01 * np.random.random(class1.shape[0]), 'bo', label="estimated class1")
ax.plot(class2[:, 0], -0.03 - 0.01 * np.random.random(class2.shape[0]), 'ro', label="estimated class2")
ax.plot(class3[:, 0], -0.03 - 0.01 * np.random.random(class3.shape[0]), 'go', label="estimated class3")
plt.legend(loc="best")
plt.title("GMM Data")
# plt.show()

#Errors:
# print("初始化权重: ", alpha1, alpha2, alpha3)
# print("EM估算权重:   ", alpha[0], alpha[1], alpha[2])

# print("初始化均值: ", mu1, mu2, mu3)
# print("EM估算均值:   ", mu[0], mu[1], mu[2])

# print("初始化协方差: ", sigma2_1, sigma2_2, sigma2_3)
# print("EM估算协方差:   ", cov[0], cov[1], cov[2])

gmm=GaussianMixture(n_components=3,covariance_type="diag",max_iter=100)
# dataall=np.array(Y,np.newaxis).reshape(-1,1)
gmm.fit(Y)
a=np.array(gmm.weights_)
b=np.array(gmm.means_)
c=np.array(gmm.covariances_)

print("调用机器学习中的GaussianMixture混合函数求解方法得到的结果!")
print("权重:  ",a.reshape(1,-1))
print("均值:  ",b.reshape(1,-1))
print("协方差:",c.reshape(1,-1))
结果打印
分析:GaussianMixture产生的均值和方差和原始数据的均值方差是不一样的,因为混合模型求解的方差均值会受到其他模型的影响,即从整体性来看,与原始的分布不一样。
问题:如何根据求出的协方差求取单个模型的的标准差?
混合模型中求得单个变量的协方差是不是单个模型标准差的平方??待验证
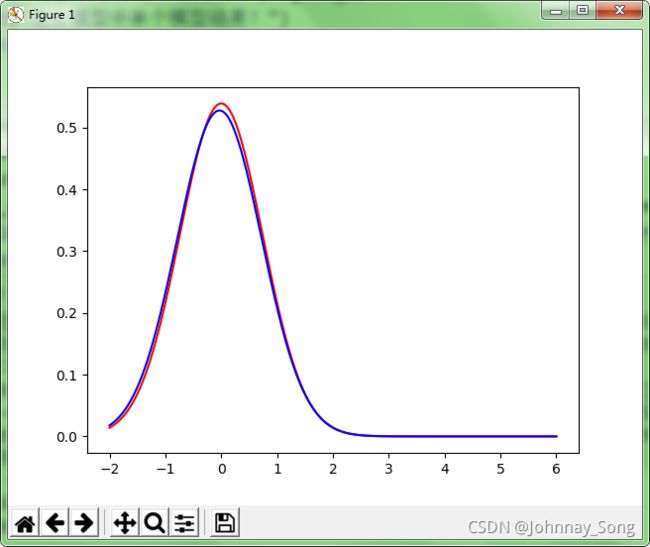
混合高斯模型最后得到的单个模型的均值和协方差和原来数据差不多
#混合模型图
#单个模型图(均值和协方差生成的)
1:原始高斯分布
2:GaussianMixture拟合的结果,取均值和协方差,然后建立的分布
3:高斯混合模型的图像
#结论:可以1和2的分布还是基本一致的。
#(均值和标准差生成的)(标准差=sqrt(协方差))
#最终效果图
#1:模型1的原始分布
2:从混合模型中得出关于模型1的参数进行重建分布的结果
3:原始混合数据分布
4:高斯混合模型拟合后的数据分布
#可视化代码:
from matplotlib import colors
import numpy as np
import matplotlib.pyplot as plt
from gmm_em import gmm_em
from gmm_em import gaussian
from sklearn.neighbors import KernelDensity
from sklearn.mixture import GaussianMixture
import numpy as np
import matplotlib.pyplot as plt
from scipy.stats import multivariate_normal
from mpl_toolkits.mplot3d import Axes3D

D = 1 # 2d data
K = 3 # 3 mixtures

#1:
n1 = 70
mu1 = [0]
sigma2_1 = [[0.3]]
#2:
n2 = 150
mu2 = [2]
sigma2_2  = [[0.2]]
#3:
n3 = 100
mu3 = [4]
sigma2_3  = [[0.3]]

N = n1 + n2 + n3
alpha1 = n1/N
alpha2 = n2/N
alpha3 = n3/N

sample1 = np.random.multivariate_normal(mean=mu1, cov=sigma2_1, size=n1)
sample2 = np.random.multivariate_normal(mean=mu2, cov=sigma2_2, size=n2)
sample3 = np.random.multivariate_normal(mean=mu3, cov=sigma2_3, size=n3)

#计算原始数据的均值、方差
all_data=[sample1,sample2,sample3]
real_mean=[]
real_sigma=[]
for data in all_data:
    mean=np.sum(data)/len(data)
    real_mean.append(mean)
for index, data in enumerate(all_data) :
    sigma_squ=np.sum(np.power((data-real_mean[index]),2))/len(data)
    sigma=np.power(sigma_squ,0.5)
    real_sigma.append(sigma)
print("原始数据均值:",real_mean)
print("原始数据方差:",real_sigma)


Y = np.concatenate((sample1, sample2, sample3),axis=0)
Y_plot = np.linspace(-2, 6, 1000)[:, np.newaxis]
true_dens = (alpha1 * gaussian(Y_plot[:, 0], mu1, sigma2_1)
             + alpha2 * gaussian(Y_plot[:, 0], mu2, sigma2_2)
             + alpha2 * gaussian(Y_plot[:, 0], mu3, sigma2_3))

#第一个模型的原始分布
sigmaone=pow(0.3,0.5)
sigma12_1=[[sigmaone]]
true_dens1 = (gaussian(Y_plot[:, 0], mu1, sigma12_1))
fig, ax = plt.subplots()
ax.plot(Y_plot[:, 0], true_dens1, color="red", label='true distribution')

#三个模型的分布
ax.fill(Y_plot[:, 0], true_dens, fc='g', alpha=0.2, label='true distribution')
ax.plot(sample1[:, 0], -0.005 - 0.01 * np.random.random(sample1.shape[0]), 'b+', label="input class1")
ax.plot(sample2[:, 0], -0.005 - 0.01 * np.random.random(sample2.shape[0]), 'r+', label="input class2")
ax.plot(sample3[:, 0], -0.005 - 0.01 * np.random.random(sample3.shape[0]), 'g+', label="input class3")
# kernel = 'gaussian'
# kde = KernelDensity(kernel=kernel, bandwidth=0.5).fit(Y)
# log_dens = kde.score_samples(Y_plot)
# ax.plot(Y_plot[:, 0], np.exp(log_dens), '-', label="input distribution".format(kernel))
# ax.set_xlim(-2, 6)


#调用EM算法迭代
omega, alpha, mu, cov = gmm_em(Y, K, 100)
est_dens = (alpha[0] * gaussian(Y_plot[:, 0], mu[0], cov[0])
             + alpha[1] * gaussian(Y_plot[:, 0], mu[1], cov[1])
             + alpha[2] * gaussian(Y_plot[:, 0], mu[2], cov[2]))
#EM算法结果进行混合模型的拟合
ax.fill(Y_plot[:, 0], est_dens, fc='blue', alpha=0.2, label='estimated distribution')


#调用GaussianMixture函数拟合
gmm=GaussianMixture(n_components=3,covariance_type="diag",max_iter=100)
gmm.fit(Y)
a=np.array(gmm.weights_)
b=np.array(gmm.means_)
c=np.array(gmm.covariances_)
a12=np.squeeze(a.reshape(1,-1))
b12=np.squeeze(b.reshape(1,-1))
c12=np.squeeze(c.reshape(1,-1))
a1=a12.tolist()
b1=b12.tolist()
c1=c12.tolist()
print("调用机器学习中的GaussianMixture混合函数求解方法得到的结果!")
print("权重:  ",a1)
print("均值:  ",b1)
print("协方差:",c1)

#最小均值的索引
min_mean_index=b1.index(min(b1))
min_mean_value=min(b1)
min_con_value=c1[min_mean_index]
print("单个模型结果!")
print("均值:",mu1, "协方差:",sigma2_1)
print("混合模型中单个模型结果!")
print("均值:",min_mean_value,"协方差:",min_con_value)

#根据混合模型的结果,获取第一个模型拟合的结果,并进行可视化
sigmatwo=pow(min_con_value,0.5)
Y_plott = np.linspace(-2, 6, 1000)[:, np.newaxis]
true_dens1t = ( gaussian(Y_plott[:, 0], [min_mean_value], [[sigmatwo]]))
ax.plot(Y_plott[:, 0], true_dens1t, color="blue", label='1 distribution')
plt.show()
#EM算法代码
# -*- coding:utf-8 -*-
import numpy as np
from scipy.stats import multivariate_normal

def scale_data(Y):
    #Y: [N*D]
    #N: number of data points
    #D: dimension of data
    X = np.zeros(Y.shape)
    for i in range(Y.shape[1]):
        max_ = Y[:, i].max()
        min_ = Y[:, i].min()
        X[:, i] = (Y[:, i] - min_) / (max_ - min_)

    return X

def gaussian(X, mu_k, cov_k):
    norm = multivariate_normal(mean=mu_k, cov=cov_k)
    return norm.pdf(X)

def gmm_em(Y, K, iters):
    #X = scale_data(Y)
    X = Y
    N, D = X.shape
    #Init
    alpha = np.ones((K,1)) / K          #initially evenly distributed
    mu = np.random.rand(K, D)           #initially random mean
    cov = np.array([np.eye(D)] * K)     #intially diagonal covariance

    omega = np.zeros((N, K))

    for i in range(iters):

        #E-Step
        p = np.zeros((N, K))
        for k in range(K):
            p[:, k] = alpha[k] * gaussian(X, mu[k], cov[k])
        sumP = np.sum(p, axis=1)
        omega = p / sumP[:, None]

        #M-Step
        sumOmega = np.sum(omega, axis=0)  # [K]
        alpha = sumOmega / N              # alpha_k = sum(omega_k) / N
        for k in range(K):
            omegaX = np.multiply(X, omega[:, [k]])        # omega_k*X [N*D]
            mu[k] = np.sum(omegaX, axis=0) / sumOmega[k]  # mu[k]  = sum(omega_k*X) / sum(omega_k) : [D]

            X_mu_k = np.subtract(X, mu[k])                                         # (X - mu_k) : [N*D] - [D] = [N*D]
            omega_X_mu_k = np.multiply(omega[:, [k]], X_mu_k)                      # omega(X-mu_k) : [N*D]
            cov[k] = np.dot(np.transpose(omega_X_mu_k), X_mu_k) / sumOmega[k]      # sum(omega_i * (X_i-mu_k).T*(X_i-mu_k))  [D*D]

    return omega, alpha, mu, cov
【2】EM算法迭代求解高斯混合模型
高斯混合模型(GMM)与EM算法的推导 - 知乎
代码:MLSP/gmm at master · chenwj1989/MLSP · GitHub


