基于SVM的鸢尾花数据集不同特征的分类
基于SVM的鸢尾花数据集不同特征的分类
前言:CSDN就是毒瘤,已转向博客园,博客园主页https://www.cnblogs.com/ClarkGable/
文末附python代码
import numpy as np
from matplotlib import colors
from sklearn import svm
from sklearn.svm import SVC
from sklearn import model_selection
import matplotlib.pyplot as plt
import matplotlib as mpl
# numpy:python第三方库,用于科学计算
# matplotlib:python第三方库,用于进行可视化
# sklearn:python的重要机器学习库,其中封装了大量的机器学习算法,如:分类、回归、降维以及聚类
# 导入鸢尾花数据
from sklearn import datasets
IrisDS = datasets.load_iris()
IrisDS.keys()# 数据集包含的名字
dict_keys([‘data’, ‘target’, ‘target_names’, ‘DESCR’, ‘feature_names’, ‘filename’])
print(IrisDS.target)# 数据标签
print(IrisDS.target_names)# 山鸢尾、变色鸢尾、维吉尼亚鸢尾
print(IrisDS.feature_names)# 花萼长度、花萼宽度、花瓣长度、花瓣宽度
[0 0 0 0 0 0 0 0 0 0 0 0 0 0 0 0 0 0 0 0 0 0 0 0 0 0 0 0 0 0 0 0 0 0 0 0 0
0 0 0 0 0 0 0 0 0 0 0 0 0 1 1 1 1 1 1 1 1 1 1 1 1 1 1 1 1 1 1 1 1 1 1 1 1
1 1 1 1 1 1 1 1 1 1 1 1 1 1 1 1 1 1 1 1 1 1 1 1 1 1 2 2 2 2 2 2 2 2 2 2 2
2 2 2 2 2 2 2 2 2 2 2 2 2 2 2 2 2 2 2 2 2 2 2 2 2 2 2 2 2 2 2 2 2 2 2 2 2
2 2]
[‘setosa’ ‘versicolor’ ‘virginica’]
[‘sepal length (cm)’, ‘sepal width (cm)’, ‘petal length (cm)’, ‘petal width (cm)’]
X = IrisDS.data # X是鸢尾花数据集的样本特征
y = IrisDS.target # y是鸢尾花数据集的标签
# 以前两个特征(花萼长度、花萼宽度)绘图
X = IrisDS.data[:, :2]
plt.scatter(X[y == 0, 0], X[y == 0, 1], color = "red", marker = "o")
plt.scatter(X[y == 1, 0], X[y == 1, 1], color = "green", marker = "+")
plt.scatter(X[y == 2, 0], X[y == 2, 1], color = "blue", marker = "x")
plt.xlabel('speal length', fontsize=20)
plt.ylabel('speal width', fontsize=20)
plt.title('Iris names', fontsize=30)
plt.show()
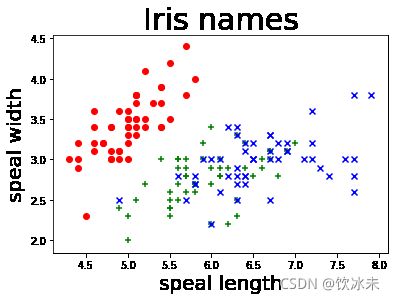
#图中第0类鸢尾花和1、 2两类明显区分开,但1、 2两类区分不明显
# 以后两个特征(花瓣长度、花瓣宽度)进行绘制
X = IrisDS.data[:, 2:]
plt.scatter(X[y == 0, 0], X[y == 0, 1], color = "red", marker = "o")
plt.scatter(X[y == 1, 0], X[y == 1, 1], color = "green", marker = "+")
plt.scatter(X[y == 2, 0], X[y == 2, 1], color = "blue", marker = "x")
plt.xlabel('petal length', fontsize=20)
plt.ylabel('petal width', fontsize=20)
plt.title('Iris names', fontsize=30)
plt.show()
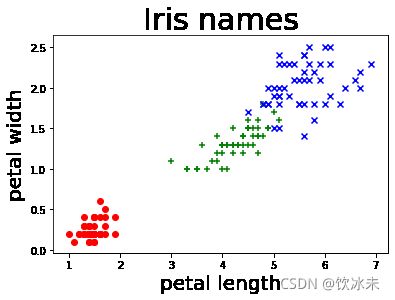
#1、 2两类区分更为明显
#数据标准化
from sklearn.preprocessing import StandardScaler

X = IrisDS.data[:, :2]
std_scaler = StandardScaler()
std_scaler.fit(X)
X = std_scaler.transform(X)
X_train,X_test,y_train,y_test=model_selection.train_test_split(X,              #所要划分的样本特征集
                                                               y,              #所要划分的样本结果
                                                               random_state=666, #随机数种子确保产生的随机数组相同
                                                               test_size=0.3)  #测试样本占比
random_state=666表示随机种子,确保了每次运行程序时用的随机数都是一样的,也就是每次重新运行后所划分的训练集和测试集的样本都是一致的,相当于只在第一次运行的时候进行随机划分。如果不设置的话,每次重新运行的种子不一样,产生的随机数也不一样就会导致每次随机生成的训练集和测试集不一致
#SVM分类器构建
clf = svm.SVC(C=1.0,                         #误差项惩罚系数,默认值是1
              kernel='linear',               #kenrel="rbf":高斯核
              decision_function_shape='ovr') #决策函数
C越大,相当于惩罚松弛变量,希望松弛变量接近0,即对误分类的惩罚增大,趋向于对训练集全分对的情况,这样对训练集测试时准确率很高,但泛化能力弱。
C值小,对误分类的惩罚减小,允许容错,将他们当成噪声点,泛化能力较强。
kernel=’linear’时,为线性核
decision_function_shape=’ovr’时,为one v rest,即一个类别与其他类别进行划分
decision_function_shape=’ovo’时,为one v one,即将类别两两之间进行划分,用二分类的方法模拟多分类的结果
ovr是多类情况1和ovo是多类情况2
#训练模型
clf.fit(X_train, y_train)  # 训练集特征向量,fit表示输入数据开始拟合
SVC(C=1.0, cache_size=200, class_weight=None, coef0=0.0,
decision_function_shape=‘ovr’, degree=3, gamma=‘auto_deprecated’,
kernel=‘linear’, max_iter=-1, probability=False, random_state=None,
shrinking=True, tol=0.001, verbose=False)
def print_accuracy(clf, X_train, y_train, X_test, y_test):
    #原始结果与预测结果进行对比   predict()表示对X_train样本进行预测,返回样本类别
    print(clf.score(X_train, y_train))
    print(clf.score(X_test, y_test))
    #计算决策函数的值,表示x到各分割平面的距离,3类,所以有3个决策函数,不同的多类情况有不同的决策函数
    print('decision_function:\n', clf.decision_function(X_train))
print_accuracy(clf, X_train, y_train, X_test, y_test)
0.819047619047619
0.8444444444444444
decision_function:
[[ 2.26754626 0.83213398 -0.25107663]
[ 2.26812082 0.89433868 -0.26160862]
[ 2.25068197 1.19254524 -0.27161213]
[-0.26378317 2.24875095 1.15332563]
[ 2.24371147 1.00708117 -0.24423143]
[ 2.27908127 0.91554909 -0.27590998]
[-0.26244513 1.20183261 2.22809452]
[-0.22983914 2.22750804 1.02208237]
[-0.28020529 1.23311061 2.2489072 ]
[-0.25814323 2.23324399 1.17481826]
[ 2.26042975 1.10372776 -0.26698532]
[ 2.27868421 0.8430594 -0.26935129]
[-0.27863833 1.22298142 2.25150891]
[-0.2844101 1.25475007 2.24000473]
[-0.27184669 2.24458611 1.2082667 ]
[-0.27611236 2.24598543 1.22256241]
[ 2.28911002 0.74361316 -0.25407183]
[-0.29156835 2.26630067 1.25017604]
[-0.27823473 1.23998988 2.23751262]
[ 2.28172587 0.79998424 -0.26611167]
[-0.29293027 1.25353472 2.26762622]
[ 2.26252216 0.90409649 -0.25587577]
[ 2.26694588 1.16168865 -0.2774333 ]
[-0.23657988 2.21857797 1.11694676]
[-0.28308445 1.24865572 2.24317375]
[-0.23530971 2.23685848 0.98274491]
[-0.27081709 2.2647009 1.10736877]
[-0.2850429 1.22720938 2.26333029]
[-0.21106259 1.13534301 2.17014314]
[-0.27654754 1.23126403 2.24085011]
[ 2.25070614 0.82248303 -0.21818887]
[-0.28472856 1.24303294 2.25333309]
[-0.26567383 1.18775542 2.24168031]
[ 2.22223474 1.18471293 -0.25477606]
[ 2.27480636 0.84886066 -0.26482838]
[-0.24673798 2.22090686 1.15644428]
[ 2.18126947 1.19228118 -0.23957537]
[-0.25496575 2.2231431 1.18374835]
[-0.26505513 1.21596768 2.22375129]
[ 2.27659698 0.82280652 -0.26301414]
[-0.20692257 2.21361822 0.95715782]
[ 2.26812082 0.89433868 -0.26160862]
[ 2.28172587 0.79998424 -0.26611167]
[ 2.26635034 1.09379989 -0.27123674]
[-0.0993317 2.20531902 0.81961508]
[-0.28596995 1.24993056 2.25084786]
[-0.27184669 2.24458611 1.2082667 ]
[ 2.2708632 0.9401196 -0.26818978]
[ 2.23916026 1.08213847 -0.24712436]
[-0.26378317 2.24875095 1.15332563]
[-0.18404181 2.21097403 0.89016293]
[-0.27982456 1.2473413 2.23392523]
[-0.26567383 1.18775542 2.24168031]
[-0.29501466 1.24292439 2.27788894]
[-0.28342035 1.23489157 2.25567294]
[ 2.22851437 1.16129601 -0.25238101]
[-0.18985506 2.2526291 0.7854142 ]
[-0.27334178 2.26105301 1.16192406]
[-0.21867225 2.25918949 0.79543407]
[-0.27081709 2.2647009 1.10736877]
[-0.29860286 1.26939533 2.27142537]
[-0.27654754 1.23126403 2.24085011]
[-0.26629732 2.25483209 1.14023479]
[-0.29421159 2.27672639 1.24155281]
[-0.27863833 1.22298142 2.25150891]
[ 2.22851437 1.16129601 -0.25238101]
[-0.29156835 2.26630067 1.25017604]
[ 2.26042975 1.10372776 -0.26698532]
[-0.27381994 2.25125726 1.20208462]
[-0.27133617 2.25592895 1.17231843]
[-0.28058064 1.21323588 2.25996472]
[ 2.26113468 1.16684706 -0.27401141]
[-0.29314772 1.24142444 2.27452428]
[-0.27697614 1.21057458 2.25395505]
[ 2.2558719 0.91472818 -0.24914686]
[-0.2847202 1.05191786 2.28337606]
[-0.28308445 1.24865572 2.24317375]
[-0.21498962 2.22544711 0.92851116]
[ 2.28689519 0.75623769 -0.25853731]
[ 2.22223474 1.18471293 -0.25477606]
[-0.27429053 1.23839012 2.22699849]
[ 2.2757097 1.07112472 -0.27829074]
[ 2.27616257 0.79080205 -0.25291992]
[ 2.25971092 0.97007289 -0.25807129]
[-0.28342035 1.23489157 2.25567294]
[ 2.27616257 0.79080205 -0.25291992]
[-0.30529254 1.26269271 2.29252729]
[-0.2496743 2.24608676 1.04692459]
[-0.28626849 1.23661033 2.26143474]
[ 2.22548646 0.95322256 -0.21947294]
[ 2.2708632 0.9401196 -0.26818978]
[ 2.21882727 1.04145958 -0.22415469]
[-0.27822398 1.02009328 2.27763327]
[-0.2850429 1.22720938 2.26333029]
[-0.26863605 2.26009747 1.12509058]
[ 2.25249524 0.98765286 -0.25173403]
[ 2.28172587 0.79998424 -0.26611167]
[-0.26442502 2.23502025 1.19710191]
[ 2.26385732 0.78529003 -0.22176871]
[-0.27430287 2.27794179 0.90980471]
[-0.25577971 1.19863521 2.2152737 ]
[-0.25496575 2.2231431 1.18374835]
[-0.18696824 2.1799931 1.03129012]
[-0.29421159 2.27672639 1.24155281]
[-0.30210781 1.25988289 2.2866272 ]]
def draw(clf, X):
    iris_feature = 'sepal length', 'sepal width', 'petal lenght', 'petal width'
    # 开始画图
    X1_min, X1_max = X[:, 0].min(), X[:, 0].max()               #第0列的范围
    X2_min, X2_max = X[:, 1].min(), X[:, 1].max()               #第1列的范围
    X1, X2 = np.mgrid[X1_min:X1_max:200j, X2_min:X2_max:200j]   #生成网格采样点 开始坐标:结束坐标(不包括):步长
    #flat将二维数组转换成1个1维的迭代器,然后把x1和x2的所有可能值给匹配成为样本点
    grid_test = np.stack((X1.flat, X2.flat), axis=1)            #stack():沿着新的轴加入一系列数组,竖着(按列)增加两个数组,grid_test的shape:(40000, 2)
    print('grid_test:\n', grid_test)
    # 输出样本到决策面的距离
    z = clf.decision_function(grid_test)
    print('the distance to decision plane:\n', z)

    grid_hat = clf.predict(grid_test)                           # 预测分类值 得到【0,0.。。。2,2,2】
    print('grid_hat:\n', grid_hat)
    grid_hat = grid_hat.reshape(X1.shape)                       # reshape grid_hat和x1形状一致
                                                                #若3*3矩阵e,则e.shape()为3*3,表示3行3列
    #light是网格测试点的配色,相当于背景
    #dark是样本点的配色
    cm_light = mpl.colors.ListedColormap(['#A0FFA0', '#A0A0FF', '#FFA0A0'])
    cm_dark = mpl.colors.ListedColormap(['g', 'b', 'r'])
     #画出所有网格样本点被判断为的分类,作为背景
    plt.pcolormesh(X1, X2, grid_hat, cmap=cm_light)                                   # pcolormesh(x,y,z,cmap)这里参数代入
                                                                                      # x1,x2,grid_hat,cmap=cm_light绘制的是背景。
    #squeeze()把y的个数为1的维度去掉,也就是变成一维。
    plt.scatter(X[:, 0], X[:, 1], c=np.squeeze(y), edgecolor='k', s=50, cmap=cm_dark) # 样本点
    plt.scatter(X_test[:, 0], X_test[:, 1], s=200, facecolor='yellow', zorder=10, marker='+')       # 测试点
    plt.xlabel(iris_feature[0], fontsize=20)
    plt.ylabel(iris_feature[1], fontsize=20)
    plt.xlim(X1_min, X1_max)
    plt.ylim(X2_min, X2_max)
    plt.title('svm in iris data classification', fontsize=30)
    plt.grid()
    plt.show()
draw(clf, X)
grid_test:
[[-1.87002413 -2.43394714]
[-1.87002413 -2.40618472]
[-1.87002413 -2.37842229]
…
[ 2.4920192 3.0352504 ]
[ 2.4920192 3.06301282]
[ 2.4920192 3.09077525]]
the distance to decision plane:
[[-0.21503918 2.27377304 0.75487961]
[-0.2120072 2.27330025 0.75426889]
[-0.20881572 2.2728199 0.75366658]
…
[-0.23794195 0.78081781 2.27177003]
[-0.23598009 0.77912046 2.27146904]
[-0.23393585 0.77747285 2.27116509]]
grid_hat:
[1 1 1 … 2 2 2]
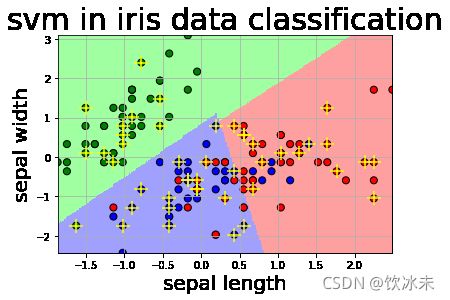
我们可以看到,仅依靠萼片长度和萼片宽度作为两种特征进行模型训练,在Iris-versicolor(红点所示) 与Iris-virginica(蓝点所示) 之间并不能达到很好的分类效果。
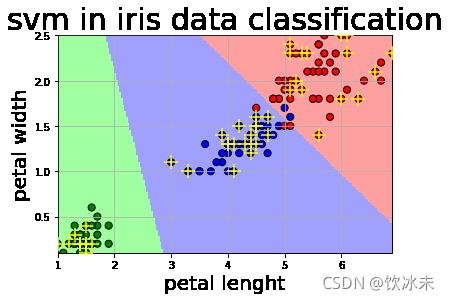
但是如果我们选取的是花瓣长度和花瓣宽度作为特征进行训练,则情况就完全不一样了:
X2 = IrisDS.data[:, 2:]
X2_train,X2_test,y2_train,y2_test=model_selection.train_test_split(X2,               #所要划分的样本特征集
                                                                   y,                #所要划分的样本结果
                                                                   random_state=666, #随机数种子确保产生的随机数组相同
                                                                   test_size=0.3)    #测试样本占比
# 数据标准化
std_scaler.fit(X)
X2 = std_scaler.transform(X2)

#***********************训练模型*****************************
clf.fit(X2_train, y2_train) # 训练集特征向量,fit表示输入数据开始拟合
# 模型评估
print_accuracy(clf,X2_train,y2_train,X2_test,y2_test)

def draw2(clf, X):
    iris_feature = 'sepal length', 'sepal width', 'petal lenght', 'petal width'
    # 开始画图
    X1_min, X1_max = X[:, 0].min(), X[:, 0].max()               # 第0列的范围
    X2_min, X2_max = X[:, 1].min(), X[:, 1].max()               # 第1列的范围
    X1, X2 = np.mgrid[X1_min:X1_max:200j, X2_min:X2_max:200j]   # 生成网格采样点(用meshgrid函数生成两个网格矩阵X1和X2)
    # flat将二维数组转换成1个1维的迭代器,然后把x1和x2的所有可能值给匹配成为样本点
    grid_test = np.stack((X1.flat, X2.flat), axis=1)            # stack():沿着新的轴加入一系列数组,竖着(按列)增加两个数组,grid_test的shape:(40000, 2)
    print('grid_test:\n', grid_test)
    # 输出样本到决策面的距离
    z = clf.decision_function(grid_test)
    print('the distance to decision plane:\n', z)

    grid_hat = clf.predict(grid_test)                           # 预测分类值 得到[0,0.。。。2,2,2]
    print('grid_hat:\n', grid_hat)
    grid_hat = grid_hat.reshape(X1.shape)                       # reshape grid_hat和x1形状一致
                                                                #若3*3矩阵e,则e.shape()为3*3,表示3行3列
    #light是网格测试点的配色,相当于背景
    #dark是样本点的配色
    cm_light = mpl.colors.ListedColormap(['#A0FFA0', '#A0A0FF', '#FFA0A0'])
    cm_dark = mpl.colors.ListedColormap(['g', 'b', 'r'])
     #画出所有网格样本点被判断为的分类,作为背景
    plt.pcolormesh(X1, X2, grid_hat, cmap=cm_light)                                   # pcolormesh(x,y,z,cmap)这里参数代入
                                                                                      # x1,x2,grid_hat,cmap=cm_light绘制的是背景。
    #squeeze()把y的个数为1的维度去掉,也就是变成一维。
    plt.scatter(X[:, 0], X[:, 1], c=np.squeeze(y), edgecolor='k', s=50, cmap=cm_dark) # 样本点
    plt.scatter(X2_test[:, 0], X2_test[:, 1], s=200, facecolor='yellow', zorder=10, marker='+')       # 测试点
    plt.xlabel(iris_feature[2], fontsize=20)
    plt.ylabel(iris_feature[3], fontsize=20)
    plt.xlim(X1_min, X1_max)
    plt.ylim(X2_min, X2_max)
    plt.title('svm in iris data classification', fontsize=30)
    plt.grid()
    plt.show()


draw2(clf, X2)
0.9428571428571428
1.0
decision_function:
[[ 2.24772934 1.29454547 -0.30431667]
[ 2.23476351 1.29016295 -0.30033997]
[ 2.25155637 1.29472208 -0.30486566]
[-0.23246107 2.27346288 0.76882003]
[ 2.25155637 1.29472208 -0.30486566]
[ 2.24986716 1.29376755 -0.30414074]
[-0.27914331 1.23614206 2.24376444]
[-0.24859519 2.26973677 0.81111145]
[-0.25724089 2.26605415 0.87846242]
[-0.26157711 2.26251524 0.98067666]
[ 2.24352653 1.29436723 -0.30374609]
[ 2.25317855 1.29563165 -0.30555546]
[-0.28824141 1.19444536 2.27770631]
[-0.27403982 1.24840402 2.20973547]
[-0.26333964 2.26987876 0.89026505]
[-0.27205344 1.24924619 2.19867391]
[ 2.24394177 1.2925696 -0.30276944]
[-0.27130941 2.26006775 1.15064614]
[-0.25234689 2.26925621 0.82645069]
[ 2.22222222 1.29177039 -0.30006642]
[-0.268096 2.26384897 1.07932762]
[ 2.24986716 1.29376755 -0.30414074]
[ 2.26249131 1.2961279 -0.30701319]
[-0.27764977 1.24666801 2.22717599]
[-0.28667954 1.22313472 2.26822899]
[-0.27573035 1.23832007 2.23165943]
[-0.21321608 2.27835275 0.74440879]
[-0.27130941 2.26006775 1.15064614]
[-0.28824141 1.19444536 2.27770631]
[-0.28942618 1.21158763 2.27639055]
[ 2.23662947 1.29320585 -0.30233656]
[-0.26184245 2.26776992 0.90115464]
[-0.28980035 1.1784697 2.28208753]
[ 2.25317855 1.29563165 -0.30555546]
[ 2.25155637 1.29472208 -0.30486566]
[-0.27205344 1.24924619 2.19867391]
[ 2.24352653 1.29436723 -0.30374609]
[-0.27403982 1.24840402 2.20973547]
[-0.28369411 1.24297403 2.25054111]
[ 2.24394177 1.2925696 -0.30276944]
[-0.24678008 2.27216731 0.794948 ]
[ 2.2535095 1.2939513 -0.30469635]
[ 2.24587654 1.29358207 -0.30356315]
[ 2.25155637 1.29472208 -0.30486566]
[-0.26157711 2.26251524 0.98067666]
[-0.26428571 2.26191883 1.04597704]
[-0.23994253 2.2706766 0.78784522]
[ 2.24352653 1.29436723 -0.30374609]
[ 2.2317681 1.29108742 -0.30056451]
[-0.27840669 1.24170635 2.23617318]
[-0.24447901 2.27021019 0.79845938]
[-0.27524844 2.25877945 1.1863407 ]
[-0.28783984 1.22168378 2.27092916]
[-0.28636392 1.24974084 2.2522149 ]
[-0.28268171 1.21280181 2.26411059]
[ 2.24950526 1.29546327 -0.30503299]
[-0.26403823 2.2556395 1.11403506]
[-0.27748893 1.2372434 2.23809504]
[-0.17042606 2.27974262 0.73109348]
[-0.22367655 2.27601191 0.75495815]
[-0.28743105 1.23999006 2.26227157]
[-0.28369411 1.24297403 2.25054111]
[-0.19505575 2.27905658 0.73712759]
[-0.27334352 2.25942922 1.17042575]
[-0.26679727 2.26131229 1.09205627]
[ 2.24772934 1.29454547 -0.30431667]
[-0.27670632 1.24268583 2.22946607]
[ 2.25505585 1.2948971 -0.30539427]
[-0.27607157 1.25513681 2.20304642]
[-0.23773298 2.27303717 0.77626062]
[-0.28884168 1.20358023 2.27705612]
[ 2.25505585 1.2948971 -0.30539427]
[-0.28999552 1.21866417 2.27570905]
[-0.29090561 1.19948404 2.28097294]
[ 2.24772934 1.29454547 -0.30431667]
[-0.29421043 1.21912496 2.28283989]
[-0.28721205 1.21498592 2.27172763]
[-0.21597559 2.27247532 0.75831952]
[ 2.25155637 1.29472208 -0.30486566]
[ 2.24986716 1.29376755 -0.30414074]
[-0.28500557 1.2420008 2.25485913]
[ 2.25505585 1.2948971 -0.30539427]
[ 2.23425838 1.29217387 -0.30147516]
[ 2.23934884 1.29237269 -0.30213572]
[-0.2750734 1.25190936 2.20647906]
[ 2.25190081 1.29295778 -0.30396266]
[-0.29656934 1.21431606 2.28745838]
[-0.24859519 2.26973677 0.81111145]
[-0.28545849 1.22454843 2.26528458]
[ 2.25505585 1.2948971 -0.30539427]
[ 2.2280143 1.29382255 -0.30189125]
[ 2.23888972 1.29418735 -0.30315261]
[-0.29722637 1.19352189 2.29085786]
[-0.28417182 1.22592633 2.26206122]
[-0.22987843 2.27562179 0.76046202]
[ 2.24772934 1.29454547 -0.30431667]
[ 2.24352653 1.29436723 -0.30374609]
[-0.26568332 2.26441371 1.02773854]
[ 2.25826812 1.29507053 -0.3059036 ]
[-0.19505575 2.27905658 0.73712759]
[-0.26157711 2.26251524 0.98067666]
[-0.26308532 2.26496934 0.96145145]
[-0.27205344 1.24924619 2.19867391]
[-0.23298464 2.27726209 0.75866974]
[-0.29109102 1.23060629 2.27429591]]
grid_test:
[[1. 0.1 ]
[1. 0.1120603]
[1. 0.1241206]
…
[6.9 2.4758794]
[6.9 2.4879397]
[6.9 2.5 ]]
the distance to decision plane:
[[ 2.2651326 1.29629043 -0.30746568]
[ 2.26499349 1.29618674 -0.3073951 ]
[ 2.26485381 1.29608247 -0.30732412]
…
[-0.29940237 1.14076157 2.29667474]
[-0.2994367 1.13792593 2.29681558]
[-0.29947096 1.13500554 2.29695533]]
grid_hat:
[0 0 0 … 2 2 2]
#!/usr/bin/env python
# coding: utf-8

# In[1]:


import numpy as np
from matplotlib import colors
from sklearn import svm
from sklearn.svm import SVC
from sklearn import model_selection
import matplotlib.pyplot as plt
import matplotlib as mpl
# numpy:python第三方库,用于科学计算
# matplotlib:python第三方库,用于进行可视化
# sklearn:python的重要机器学习库,其中封装了大量的机器学习算法,如:分类、回归、降维以及聚类


# In[2]:


# 导入鸢尾花数据
from sklearn import datasets
IrisDS = datasets.load_iris()


# In[3]:


IrisDS.keys()# 数据集包含的名字


# In[4]:


print(IrisDS.target)# 数据标签
print(IrisDS.target_names)# 山鸢尾、变色鸢尾、维吉尼亚鸢尾
print(IrisDS.feature_names)# 花萼长度、花萼宽度、花瓣长度、花瓣宽度


# In[5]:


X = IrisDS.data # X是鸢尾花数据集的样本特征
y = IrisDS.target # y是鸢尾花数据集的标签


# In[6]:


# 以前两个特征(花萼长度、花萼宽度)绘图
X = IrisDS.data[:, :2]
plt.scatter(X[y == 0, 0], X[y == 0, 1], color = "red", marker = "o")
plt.scatter(X[y == 1, 0], X[y == 1, 1], color = "green", marker = "+")
plt.scatter(X[y == 2, 0], X[y == 2, 1], color = "blue", marker = "x")
plt.xlabel('speal length', fontsize=20)
plt.ylabel('speal width', fontsize=20)
plt.title('Iris names', fontsize=30)
plt.show()
#图中第0类鸢尾花和1、 2两类明显区分开,但1、 2两类区分不明显


# In[7]:


# 以后两个特征(花瓣长度、花瓣宽度)进行绘制
X = IrisDS.data[:, 2:]
plt.scatter(X[y == 0, 0], X[y == 0, 1], color = "red", marker = "o")
plt.scatter(X[y == 1, 0], X[y == 1, 1], color = "green", marker = "+")
plt.scatter(X[y == 2, 0], X[y == 2, 1], color = "blue", marker = "x")
plt.xlabel('petal length', fontsize=20)
plt.ylabel('petal width', fontsize=20)
plt.title('Iris names', fontsize=30)
plt.show()
#1、 2两类区分更为明显


# In[8]:


#数据标准化
from sklearn.preprocessing import StandardScaler

X = IrisDS.data[:, :2]
std_scaler = StandardScaler()
std_scaler.fit(X)
X = std_scaler.transform(X)


# In[9]:


X_train,X_test,y_train,y_test=model_selection.train_test_split(X,              #所要划分的样本特征集
                                                               y,              #所要划分的样本结果
                                                               random_state=666, #随机数种子确保产生的随机数组相同
                                                               test_size=0.3)  #测试样本占比


# ### random_state=666表示随机种子,确保了每次运行程序时用的随机数都是一样的,也就是每次重新运行后所划分的训练集和测试集的样本都是一致的,相当于只在第一次运行的时候进行随机划分。如果不设置的话,每次重新运行的种子不一样,产生的随机数也不一样就会导致每次随机生成的训练集和测试集不一致

# In[10]:


#SVM分类器构建
clf = svm.SVC(C=1.0,                         #误差项惩罚系数,默认值是1
              kernel='linear',               #kenrel="rbf":高斯核
              decision_function_shape='ovr') #决策函数


# ### C越大,相当于惩罚松弛变量,希望松弛变量接近0,即对误分类的惩罚增大,趋向于对训练集全分对的情况,这样对训练集测试时准确率很高,但泛化能力弱。
# ### C值小,对误分类的惩罚减小,允许容错,将他们当成噪声点,泛化能力较强。
# ### kernel=’linear’时,为线性核
# ### decision_function_shape=’ovr’时,为one v rest,即一个类别与其他类别进行划分
# ### decision_function_shape=’ovo’时,为one v one,即将类别两两之间进行划分,用二分类的方法模拟多分类的结果
# ### ovr是多类情况1和ovo是多类情况2

# In[11]:


#训练模型
clf.fit(X_train, y_train)  # 训练集特征向量,fit表示输入数据开始拟合


# In[12]:


def print_accuracy(clf, X_train, y_train, X_test, y_test):
    #原始结果与预测结果进行对比   predict()表示对X_train样本进行预测,返回样本类别
    print(clf.score(X_train, y_train))
    print(clf.score(X_test, y_test))
    #计算决策函数的值,表示x到各分割平面的距离,3类,所以有3个决策函数,不同的多类情况有不同的决策函数
    print('decision_function:\n', clf.decision_function(X_train))


# In[13]:


print_accuracy(clf, X_train, y_train, X_test, y_test)


# In[14]:


def draw(clf, X):
    iris_feature = 'sepal length', 'sepal width', 'petal lenght', 'petal width'
    # 开始画图
    X1_min, X1_max = X[:, 0].min(), X[:, 0].max()               #第0列的范围
    X2_min, X2_max = X[:, 1].min(), X[:, 1].max()               #第1列的范围
    X1, X2 = np.mgrid[X1_min:X1_max:200j, X2_min:X2_max:200j]   #生成网格采样点 开始坐标:结束坐标(不包括):步长
    #flat将二维数组转换成1个1维的迭代器,然后把x1和x2的所有可能值给匹配成为样本点
    grid_test = np.stack((X1.flat, X2.flat), axis=1)            #stack():沿着新的轴加入一系列数组,竖着(按列)增加两个数组,grid_test的shape:(40000, 2)
    print('grid_test:\n', grid_test)
    # 输出样本到决策面的距离
    z = clf.decision_function(grid_test)
    print('the distance to decision plane:\n', z)

    grid_hat = clf.predict(grid_test)                           # 预测分类值 得到【0,0.。。。2,2,2】
    print('grid_hat:\n', grid_hat)
    grid_hat = grid_hat.reshape(X1.shape)                       # reshape grid_hat和x1形状一致
                                                                #若3*3矩阵e,则e.shape()为3*3,表示3行3列
    #light是网格测试点的配色,相当于背景
    #dark是样本点的配色
    cm_light = mpl.colors.ListedColormap(['#A0FFA0', '#A0A0FF', '#FFA0A0'])
    cm_dark = mpl.colors.ListedColormap(['g', 'b', 'r'])
     #画出所有网格样本点被判断为的分类,作为背景
    plt.pcolormesh(X1, X2, grid_hat, cmap=cm_light)                                   # pcolormesh(x,y,z,cmap)这里参数代入
                                                                                      # x1,x2,grid_hat,cmap=cm_light绘制的是背景。
    #squeeze()把y的个数为1的维度去掉,也就是变成一维。
    plt.scatter(X[:, 0], X[:, 1], c=np.squeeze(y), edgecolor='k', s=50, cmap=cm_dark) # 样本点
    plt.scatter(X_test[:, 0], X_test[:, 1], s=200, facecolor='yellow', zorder=10, marker='+')       # 测试点
    plt.xlabel(iris_feature[0], fontsize=20)
    plt.ylabel(iris_feature[1], fontsize=20)
    plt.xlim(X1_min, X1_max)
    plt.ylim(X2_min, X2_max)
    plt.title('svm in iris data classification', fontsize=30)
    plt.grid()
    plt.show()


# In[15]:


draw(clf, X)


# ### 我们可以看到,仅依靠萼片长度和萼片宽度作为两种特征进行模型训练,在Iris-versicolor(红点所示) 与Iris-virginica(蓝点所示) 之间并不能达到很好的分类效果。
#
# ### 但是如果我们选取的是花瓣长度和花瓣宽度作为特征进行训练,则情况就完全不一样了:

# In[16]:


X2 = IrisDS.data[:, 2:]
X2_train,X2_test,y2_train,y2_test=model_selection.train_test_split(X2,               #所要划分的样本特征集
                                                                   y,                #所要划分的样本结果
                                                                   random_state=666, #随机数种子确保产生的随机数组相同
                                                                   test_size=0.3)    #测试样本占比
# 数据标准化
std_scaler.fit(X)
X2 = std_scaler.transform(X2)

#***********************训练模型*****************************
clf.fit(X2_train, y2_train) # 训练集特征向量,fit表示输入数据开始拟合
# 模型评估
print_accuracy(clf,X2_train,y2_train,X2_test,y2_test)

def draw2(clf, X):
    iris_feature = 'sepal length', 'sepal width', 'petal lenght', 'petal width'
    # 开始画图
    X1_min, X1_max = X[:, 0].min(), X[:, 0].max()               # 第0列的范围
    X2_min, X2_max = X[:, 1].min(), X[:, 1].max()               # 第1列的范围
    X1, X2 = np.mgrid[X1_min:X1_max:200j, X2_min:X2_max:200j]   # 生成网格采样点(用meshgrid函数生成两个网格矩阵X1和X2)
    # flat将二维数组转换成1个1维的迭代器,然后把x1和x2的所有可能值给匹配成为样本点
    grid_test = np.stack((X1.flat, X2.flat), axis=1)            # stack():沿着新的轴加入一系列数组,竖着(按列)增加两个数组,grid_test的shape:(40000, 2)
    print('grid_test:\n', grid_test)
    # 输出样本到决策面的距离
    z = clf.decision_function(grid_test)
    print('the distance to decision plane:\n', z)

    grid_hat = clf.predict(grid_test)                           # 预测分类值 得到[0,0.。。。2,2,2]
    print('grid_hat:\n', grid_hat)
    grid_hat = grid_hat.reshape(X1.shape)                       # reshape grid_hat和x1形状一致
                                                                #若3*3矩阵e,则e.shape()为3*3,表示3行3列
    #light是网格测试点的配色,相当于背景
    #dark是样本点的配色
    cm_light = mpl.colors.ListedColormap(['#A0FFA0', '#A0A0FF', '#FFA0A0'])
    cm_dark = mpl.colors.ListedColormap(['g', 'b', 'r'])
     #画出所有网格样本点被判断为的分类,作为背景
    plt.pcolormesh(X1, X2, grid_hat, cmap=cm_light)                                   # pcolormesh(x,y,z,cmap)这里参数代入
                                                                                      # x1,x2,grid_hat,cmap=cm_light绘制的是背景。
    #squeeze()把y的个数为1的维度去掉,也就是变成一维。
    plt.scatter(X[:, 0], X[:, 1], c=np.squeeze(y), edgecolor='k', s=50, cmap=cm_dark) # 样本点
    plt.scatter(X2_test[:, 0], X2_test[:, 1], s=200, facecolor='yellow', zorder=10, marker='+')       # 测试点
    plt.xlabel(iris_feature[2], fontsize=20)
    plt.ylabel(iris_feature[3], fontsize=20)
    plt.xlim(X1_min, X1_max)
    plt.ylim(X2_min, X2_max)
    plt.title('svm in iris data classification', fontsize=30)
    plt.grid()
    plt.show()


draw2(clf, X2)


