- Scikit-learn:机器学习的「万能工具箱」
科技林总
DeepSeek学AI人工智能
——三行代码构建AI模型的全栈指南**###**一、诞生背景:让机器学习从实验室走向大众****2010年前的AI困境**:-学术界模型难以工程化-算法实现碎片化(MATLAB/C++主导)-企业应用门槛极高>**破局者**:DavidCournapeau发起*Scikit-learn*项目,**统一算法接口**+**Python简易语法**=机器学习民主化革命---###**二、设计哲学:一致性
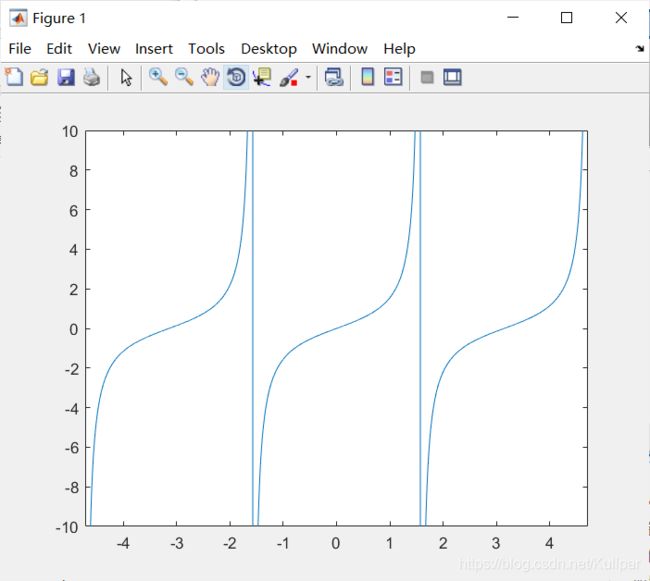
- 基于MATLAB图像特征识别及提取实现图像分类
jghhh01
机器学习算法人工智能
基于MATLAB的图形处理程序,可以进行图像特征识别及提取,进而实现图像分类。hog_svm.m,2276svm_images/test_image/1.jpg,20980svm_images/test_image/2.jpg,18246svm_images/test_image/3.jpg,13835svm_images/test_image/4.jpg,18539svm_images/test
- MATLAB算法实战应用案例精讲-【数模应用】主效应&交互效应&单独效应
林聪木
matlab算法开发语言
目录前言几个相关概念因素和水平主效应单纯主效应交互作用效应或影响(effect)因素之间的相互制约和影响两因素交互作用三因素及多因素交互作用几个高频面试题目什么是主效应,交互效应,单独效应?回归分析中是必须加入控制变量的吗?如果假如控制变量之后,显著性不高了该怎么办?控制变量说明控制变量选择控制变量处理主效应和交互效应的联系与区别如何依据主效应和交互效应描述结果?算法原理数学模型主效应二分变量交互
- 在MATLAB中使用GPU加速计算及多GPU配置
东北豆子哥
CUDA数值计算/数值优化Matlab/Octavematlab
文章目录在MATLAB中使用GPU加速计算及多GPU配置一、基本GPU加速使用1.检查GPU可用性2.将数据传输到GPU3.执行GPU计算二、多GPU配置与使用1.选择特定GPU设备2.并行计算工具箱中的多GPU支持3.数据并行处理(适用于深度学习)三、高级技巧1.异步计算2.优化GPU内存使用3.使用GPU加速函数四、注意事项在MATLAB中使用GPU加速计算及多GPU配置MATLAB提供了强大
- python学习记录14
彤银浦
学习python
1.字符串的编码和解码不同的计算机之间在信道中传输的信息本质上是二进制数据,因此当你有一串文本需要传输给另外一台电脑时,则需要将这串文本编译为二进制类型的数据。python中的二进制数据类型称为byte类型。将字符串的str类型转变为byte类型称为字符串的编码,将byte类型转变为str类型称为字符串的解码。字符串的编码用到的是encode的方法,语法格式为:string.encode(enco
- 基于MATLAB的资源优化与工期固定-资源均衡分析方法研究【附代码】
拉勾科研工作室
matlab开发语言
算法与建模领域的探索者|专注数据分析与智能模型设计✨擅长算法、建模、数据分析matlab、python、仿真✅具体问题可以私信或查看文章底部二维码✅感恩科研路上每一位志同道合的伙伴!(1)资源均衡优化相关理论与问题分类在现代工程项目中,资源的合理分配和使用是确保项目按时完成、成本可控的关键因素。资源均衡优化作为项目管理中的核心环节,旨在通过调整资源的使用方案,使资源消耗在整个工期内尽可能平稳,避免
- 医学图像增强的层级化模糊与虚拟仪器无参考质量评价研究【附代码】
拉勾科研工作室
计算机视觉图像处理人工智能
算法与建模领域的探索者|专注数据分析与智能模型设计✨擅长算法、建模、数据分析matlab、python、仿真✅具体问题可以私信或查看文章底部二维码✅感恩科研路上每一位志同道合的伙伴!(1)层级模糊隶属度的X光医学图像增强算法针对X光医学图像普遍存在的对比度差、细节模糊等问题,本算法提出了一种基于层级模糊隶属度的增强方法。该方法的核心思想在于利用拉普拉斯金字塔分解图像,并在多尺度下分层计算模糊隶属度
- 《现代通信原理与技术》模拟调制与解调—FM 调制实验报告
不想秃头的程序
人工智能matlab信息与通信信号处理
摘要本实验旨在通过MATLAB软件进行模拟调制与解调的实践,加深对频率调制(FrequencyModulation,FM)原理的理解,并掌握FM调制与解调的实现方法。关键词:MATLAB引言在现代通信系统中,调制技术是实现信息传输的核心方法之一。频率调制(FrequencyModulation,FM)作为一种重要的模拟调制方式,通过改变载波信号的频率来传递信息,广泛应用于广播、电视、无线通信等领域
- P25:LSTM实现糖尿病探索与预测
?Agony
lstm人工智能rnn
本文为365天深度学习训练营中的学习记录博客原作者:K同学啊一、相关技术1.LSTM基本概念LSTM(长短期记忆网络)是RNN(循环神经网络)的一种变体,它通过引入特殊的结构来解决传统RNN中的梯度消失和梯度爆炸问题,特别适合处理序列数据。结构组成:遗忘门:决定丢弃哪些信息,通过sigmoid函数输出0-1之间的值,表示保留或遗忘的程度。输入门:决定更新哪些信息,同样通过sigmoid函数控制更新
- MATLAB实现WOA-BP鲸鱼优化算法优化BP神经网络多输入单输出回归预测(含模型描述及示例代码)
nantangyuxi
MATLAB含模型描述及示例代码算法matlab神经网络大数据人工智能深度学习机器学习
目录MATLAB实现WOA-BP鲸鱼优化算法优化BP神经网络多输入单输出回归预测(多指标,多图)1项目背景介绍...1项目目标与意义...2项目挑战...3项目特点与创新...5<
- python爬虫框架scrapy学习记录
苏州向日葵
pythonpython爬虫scrapy
一爬虫简介爬虫这种技术听说好多年了,知道它从互联网抓取数据非常厉害,但由于不是专门从事相关工作,了解也就是听听。最近有些空闲,打算实际学习一下,这里做个小小记录。二常用框架介绍通用性框架类型说明scrapy最流行的爬虫框架,功能全面,扩展性强,社区支持完善,适用于中大型爬虫项目pySpider国产爬虫框架,自带web界面,方便监控和管理轻量级框架beautifulSoup+Requests经典的轻
- c语言opencv所用库函数,Py之cv2:cv2库(OpenCV,opencv-python)的简介、安装、使用方法(常见函数、方法等)最强详细攻略...
weixin_39729272
c语言opencv所用库函数
##关于OpenCV简介##OpenCV是一个基于BSD许可(开源)发行的跨平台计算机视觉库,可以运行在Linux、Windows、Android和MacOS操作系统上。它轻量级而且高效——由一系列C函数和少量C++类构成,同时提供了Python、Ruby、MATLAB等语言的接口,实现了图像处理和计算机视觉方面的很多通用算法。OpenCV用C++语言编写,它的主要接口也是C++语言,但是依然保留
- 2021-01-12
牛奶能压惊Becky
量化经验分享
Wind量化因子回测学习记录将anaconda和wind联动起来,快捷的做法:先在wind终端里面点点点,量化——修复插件——修复Python插件,就不放图了,最终小窗口都是绿色小对勾就好啦。再继续点点点,量化——API接口——Python接口,就出来了WindPy的安装教程。需要找到1.anaconda安装目录下的python.exe2.Wind安装的位置,在电脑自己的cmd里输入如下三个路径即
- 数学实验matlab课后习题,数学实验练习题(MATLAB)
沈洲行
数学实验matlab课后习题
注意:在下面的题目中m为你的学号的后3位(1-9班)或4位(10班以上).第一次练习题1.求解下列各题:1)30sinlimxmxmxx->-2)(4)cos,1000.0=xmxyey求3)21/20mxedx?(求近似值,可以先用inline定义被积函数,然后用quad命令)4)4224xdxmx+?50x=展开(最高次幂为8).2.对矩阵21102041Am-???=??-??,分别求逆矩阵
- 基于小波变换的数字信号调制识别
yong9990
matlab
基于小波变换的数字信号调制识别,通过matlab实现am_ofdm_classification.m,2926dvbt_table_gen.m,16437guard_interval.m,8441pilot_imag.m,9196pilot_real.m,9308randomization.m,9204sc_ofdm_wavelet.m,3439source.m,8486test_sc1.m,34
- MATLAB安装过程中源文件服务器不可达的核心问题与解决方案
百态老人
matlab服务器php
一、核心问题分析在MATLAB网络安装过程中,源文件服务器不可达可能由以下因素导致:网络连接问题网络不稳定或完全中断,导致安装程序无法访问MathWorks服务器。本地网络配置(如DNS解析错误、代理设置不当)影响连接。防火墙/安全软件拦截操作系统防火墙或第三方防病毒软件(如Symantec、McAfee)可能阻止MATLAB访问必要端口。某些安全软件将安装程序误判为威胁,直接中断连接。VPN或代
- 【教程4>第7章>第23节】基于FPGA的RS(204,188)译码verilog实现7——欧几里得迭代算法模块
fpga和matlab
#第7章·通信—信道编译码fpga开发RS译码欧几里得迭代教程4
目录1.软件版本2.RS译码器逆元欧几里得算法模块原理分析3.RS译码器逆元欧几里得算法模块的verilog实现3.1RS译码器逆元欧几里得算法模块verilog程序3.2程序解析欢迎订阅FPGA/MATLAB/Simulink系列教程《★教程1:matlab入门100例》《★教程2:fpga入门100例》《★教程3:simulink入门60例》
- 前端开发者的 Docker 学习记录
人工智能的苟富贵
软件工程docker学习容器
文章目录前言一、什么是Docker?二、安装DockerWindowsmacOSLinux三、Docker的基本概念四、构建一个简单的Docker镜像目录结构Dockerfile构建镜像运行容器五、Dockerfile详解以下是一个更详细的Dockerfile示例:指令详解六、多阶段构建示例:七、DockerCompose简介示例docker-compose.yml文件八、使用Docker部署前端
- 一套基于粒子群优化(PSO)算法的天线波束扫描MATLAB实现方案
pk_xz123456
MATLAB深度学习算法算法matlab人工智能制造开发语言分类
以下是一套基于粒子群优化(PSO)算法的天线波束扫描MATLAB实现方案,包含完整代码、数学原理和详细注释。该方案针对均匀线性阵列(ULA)的波束方向图优化,通过调整阵元相位实现主瓣指向目标方向并抑制旁瓣。%%天线波束扫描的PSO算法实现%作者:DeepSeek%创建日期:2025-06-21%功能:使用PSO优化均匀线性阵列的相位分布,实现波束扫描和旁瓣抑制clc;clear;closeall;
- MATLAB中的size函数
不知更鸟
matlab
**MATLAB中的size函数用于获取矩阵或数组的维度信息,包括行数和列数**。以下是对size函数的详细解析:1.**基本用法**:当仅有一个输出参数时,`s=size(A)`会返回一个行向量,其中第一个元素是矩阵的行数,第二个元素是矩阵的列数Θic-1ΘΘic-2ΘΘic-3Θ。例如,对于二维矩阵`A`,`size(A)`返回的是`[m,n]`,表示`A`是一个`m`行`n`列的矩阵。2.*
- matlab瞬变电磁时域有限差分方法
xx155802862xx
matlab开发语言
瞬变电磁时域有限差分方法MATLAB数值仿真教程程序codelisting/Appendix_A/fdtd_1d_code.m,3184codelisting/Appendix_A/initialize_plotting_parameters.m,836codelisting/Appendix_A/plot_fields.m,353codelisting/Appendix_C/polar_plot
- GRU门控循环单元回归+SHAP分析,Matlab代码实现,通过SHAP方法量化特征贡献,构建可解释的回归模型,引入SHAP方法打破黑箱限制,提供全局及局部双重解释视角,作者:机器学习之心!
机器学习之心
可解释机器学习GRU门控循环单元回归SHAP分析
GRU门控循环单元回归+SHAP分析,Matlab代码实现,通过SHAP方法量化特征贡献,构建可解释的回归模型,引入SHAP方法打破黑箱限制,提供全局及局部双重解释视角,作者:机器学习之心!目录GRU门控循环单元回归+SHAP分析,Matlab代码实现,通过SHAP方法量化特征贡献,构建可解释的回归模型,引入SHAP方法打破黑箱限制,提供全局及局部双重解释视角,作者:机器学习之心!效果一览基本介绍
- VIVADO导出仿真数据到MATLAB中进行分析
FPGA与信号处理
FPGA学习记录VIVADOSIMULATION导出仿真数据TXTMATLAB
VIVADO导出仿真数据到MATLAB中进行分析目录前言一、导出仿真数据需要编写的RTL代码二、MATLAB读入txt文件中的数据三、需要注意的点总结前言在使用XilinxVivado进行FPGA开发时,如何将RTL仿真生成的数据导出,进行进一步分析与可视化,是很多开发者常遇到的问题。Vivado自带仿真工具不支持直接导出仿真数据,但是我们可以通过编写一段简单的RTL代码即可将需要的仿真数据保存到
- MATLAB 实现数据的插值拟合
鱼弦
人工智能时代matlab人工智能算法
MATLAB实现数据的插值拟合1.介绍插值拟合是一种通过已知数据点构建函数或曲线的方法,用于估计未知数据点的值。插值拟合广泛应用于数据分析、信号处理、图像处理等领域。本教程介绍如何使用MATLAB实现数据的插值拟合,并展示其应用场景和代码实现。2.应用使用场景(1)数据分析场景描述:通过插值拟合填补缺失数据,如时间序列数据中的缺失值。代码实现:%定义数据x=[1,2,3,4,5];y=[2,4,5
- 【智能优化算法】多目标于分解的多目标进化算法MOEA/D算法(Matlab代码实现)
荔枝科研社
单多目标智能算法算法matlab开发语言多目标进化算法MOEA/D算法
目录1概述2数学模型3运行结果4参考文献5Matlab代码及详细文章1概述基于分解的多目标进化算法(multiobjectiveevolu-tionaryalgorithmbasedondecomposition,MOEA/D)是一种利用分解策略解决多目标问题的算法2'。该算法通过聚合函数将多目标问题分解为N个子问题,每个子问题分配一个对应的权重和相关种群点的邻域"3'。种群迭代通过邻域内随机选择
- MATLAB App Designer基础教程 Matlab GUI入门(二)
Sunshine_Cherish
学习笔记Matlabmatlab开发语言程序人生
MATLABGUI入门第二天——Lamp(灯)霓虹灯控件的使用一、主要内容:技巧1.Tooltip的使用2.Vislble和Enable3.lf函数语句的使用需求:根据阈值进行提示1.红色温度过高>=500⒉橙色温度适中400~5003.蓝色温度过低=500app.lamp.Color="1,0,0";app.show_tips.Text="温度过高!";elseifvalue=400app.la
- 在Simulink中进行基于蚁群算法优化滤波器带宽的智能控制系统仿真
amy_mhd
算法前端数据库simulinkmatlab
目录一、背景介绍二、所需工具和环境三、步骤详解步骤1:定义问题与目标示例:定义优化目标步骤2:准备数据集或模拟环境示例:生成测试信号步骤3:设计并实现蚁群算法示例:简单的蚁群算法实现步骤4:创建Simulink模型步骤5:添加滤波器模块示例:添加FIR滤波器步骤6:集成蚁群算法结果示例:MATLABFunctionBlock代码步骤7:设置仿真参数步骤8:运行仿真并分析结果四、总结蚁群算法(Ant
- matlab SAR图像均值滤波
点云侠
matlab与合成孔径雷达matlab均值算法开发语言计算机视觉人工智能算法
目录一、算法原理1、计算过程2、参考文献二、代码实现三、结果展示一、算法原理1、计算过程 SAR图像的均值滤波是将平滑窗口内所有像元的强度值进行平均计算,然后赋给平滑窗口的中心像元,其数学表达式为:Ri,j=1n2∑
- matlab实现大地电磁二维正演
yugi987838
matlab开发语言
大地电磁二维正演程序,在二维平面对介质进行网格剖分,然后利用有限元进行大地电磁二维正演MT2D/2Dmodel.fig,39324MT2D/KK1.m,484MT2D/Ke1.m,254MT2D/Ke2.m,106MT2D/Ke3.m,103MT2D/MT2DMODEL.m,1648MT2D/MT2Dmesh.m,2445MT2D/TEmodel.m,4010MT2D/TMmodel.m,3903
- 基于Matlab的改进人工势场法实现路径规划与避障
bubiyoushang888
matlab
基于Matlab的改进人工势场法实现路径规划与避障circle.m,255compute_angle.m,554compute_Attract.m,305compute_repulsion.m,2606main.m,3021
- Spring4.1新特性——Spring MVC增强
jinnianshilongnian
spring 4.1
目录
Spring4.1新特性——综述
Spring4.1新特性——Spring核心部分及其他
Spring4.1新特性——Spring缓存框架增强
Spring4.1新特性——异步调用和事件机制的异常处理
Spring4.1新特性——数据库集成测试脚本初始化
Spring4.1新特性——Spring MVC增强
Spring4.1新特性——页面自动化测试框架Spring MVC T
- mysql 性能查询优化
annan211
javasql优化mysql应用服务器
1 时间到底花在哪了?
mysql在执行查询的时候需要执行一系列的子任务,这些子任务包含了整个查询周期最重要的阶段,这其中包含了大量为了
检索数据列到存储引擎的调用以及调用后的数据处理,包括排序、分组等。在完成这些任务的时候,查询需要在不同的地方
花费时间,包括网络、cpu计算、生成统计信息和执行计划、锁等待等。尤其是向底层存储引擎检索数据的调用操作。这些调用需要在内存操
- windows系统配置
cherishLC
windows
删除Hiberfil.sys :使用命令powercfg -h off 关闭休眠功能即可:
http://jingyan.baidu.com/article/f3ad7d0fc0992e09c2345b51.html
类似的还有pagefile.sys
msconfig 配置启动项
shutdown 定时关机
ipconfig 查看网络配置
ipconfig /flushdns
- 人体的排毒时间
Array_06
工作
========================
|| 人体的排毒时间是什么时候?||
========================
转载于:
http://zhidao.baidu.com/link?url=ibaGlicVslAQhVdWWVevU4TMjhiKaNBWCpZ1NS6igCQ78EkNJZFsEjCjl3T5EdXU9SaPg04bh8MbY1bR
- ZooKeeper
cugfy
zookeeper
Zookeeper是一个高性能,分布式的,开源分布式应用协调服务。它提供了简单原始的功能,分布式应用可以基于它实现更高级的服务,比如同步, 配置管理,集群管理,名空间。它被设计为易于编程,使用文件系统目录树作为数据模型。服务端跑在java上,提供java和C的客户端API。 Zookeeper是Google的Chubby一个开源的实现,是高有效和可靠的协同工作系统,Zookeeper能够用来lea
- 网络爬虫的乱码处理
随意而生
爬虫网络
下边简单总结下关于网络爬虫的乱码处理。注意,这里不仅是中文乱码,还包括一些如日文、韩文 、俄文、藏文之类的乱码处理,因为他们的解决方式 是一致的,故在此统一说明。 网络爬虫,有两种选择,一是选择nutch、hetriex,二是自写爬虫,两者在处理乱码时,原理是一致的,但前者处理乱码时,要看懂源码后进行修改才可以,所以要废劲一些;而后者更自由方便,可以在编码处理
- Xcode常用快捷键
张亚雄
xcode
一、总结的常用命令:
隐藏xcode command+h
退出xcode command+q
关闭窗口 command+w
关闭所有窗口 command+option+w
关闭当前
- mongoDB索引操作
adminjun
mongodb索引
一、索引基础: MongoDB的索引几乎与传统的关系型数据库一模一样,这其中也包括一些基本的优化技巧。下面是创建索引的命令: > db.test.ensureIndex({"username":1}) 可以通过下面的名称查看索引是否已经成功建立: &nbs
- 成都软件园实习那些话
aijuans
成都 软件园 实习
无聊之中,翻了一下日志,发现上一篇经历是很久以前的事了,悔过~~
断断续续离开了学校快一年了,习惯了那里一天天的幼稚、成长的环境,到这里有点与世隔绝的感觉。不过还好,那是刚到这里时的想法,现在感觉在这挺好,不管怎么样,最要感谢的还是老师能给这么好的一次催化成长的机会,在这里确实看到了好多好多能想到或想不到的东西。
都说在外面和学校相比最明显的差距就是与人相处比较困难,因为在外面每个人都
- Linux下FTP服务器安装及配置
ayaoxinchao
linuxFTP服务器vsftp
检测是否安装了FTP
[root@localhost ~]# rpm -q vsftpd
如果未安装:package vsftpd is not installed 安装了则显示:vsftpd-2.0.5-28.el5累死的版本信息
安装FTP
运行yum install vsftpd命令,如[root@localhost ~]# yum install vsf
- 使用mongo-java-driver获取文档id和查找文档
BigBird2012
driver
注:本文所有代码都使用的mongo-java-driver实现。
在MongoDB中,一个集合(collection)在概念上就类似我们SQL数据库中的表(Table),这个集合包含了一系列文档(document)。一个DBObject对象表示我们想添加到集合(collection)中的一个文档(document),MongoDB会自动为我们创建的每个文档添加一个id,这个id在
- JSONObject以及json串
bijian1013
jsonJSONObject
一.JAR包简介
要使程序可以运行必须引入JSON-lib包,JSON-lib包同时依赖于以下的JAR包:
1.commons-lang-2.0.jar
2.commons-beanutils-1.7.0.jar
3.commons-collections-3.1.jar
&n
- [Zookeeper学习笔记之三]Zookeeper实例创建和会话建立的异步特性
bit1129
zookeeper
为了说明问题,看个简单的代码,
import org.apache.zookeeper.*;
import java.io.IOException;
import java.util.concurrent.CountDownLatch;
import java.util.concurrent.ThreadLocal
- 【Scala十二】Scala核心六:Trait
bit1129
scala
Traits are a fundamental unit of code reuse in Scala. A trait encapsulates method and field definitions, which can then be reused by mixing them into classes. Unlike class inheritance, in which each c
- weblogic version 10.3破解
ronin47
weblogic
版本:WebLogic Server 10.3
说明:%DOMAIN_HOME%:指WebLogic Server 域(Domain)目录
例如我的做测试的域的根目录 DOMAIN_HOME=D:/Weblogic/Middleware/user_projects/domains/base_domain
1.为了保证操作安全,备份%DOMAIN_HOME%/security/Defa
- 求第n个斐波那契数
BrokenDreams
今天看到群友发的一个问题:写一个小程序打印第n个斐波那契数。
自己试了下,搞了好久。。。基础要加强了。
&nbs
- 读《研磨设计模式》-代码笔记-访问者模式-Visitor
bylijinnan
java设计模式
声明: 本文只为方便我个人查阅和理解,详细的分析以及源代码请移步 原作者的博客http://chjavach.iteye.com/
import java.util.ArrayList;
import java.util.List;
interface IVisitor {
//第二次分派,Visitor调用Element
void visitConcret
- MatConvNet的excise 3改为网络配置文件形式
cherishLC
matlab
MatConvNet为vlFeat作者写的matlab下的卷积神经网络工具包,可以使用GPU。
主页:
http://www.vlfeat.org/matconvnet/
教程:
http://www.robots.ox.ac.uk/~vgg/practicals/cnn/index.html
注意:需要下载新版的MatConvNet替换掉教程中工具包中的matconvnet:
http
- ZK Timeout再讨论
chenchao051
zookeepertimeouthbase
http://crazyjvm.iteye.com/blog/1693757 文中提到相关超时问题,但是又出现了一个问题,我把min和max都设置成了180000,但是仍然出现了以下的异常信息:
Client session timed out, have not heard from server in 154339ms for sessionid 0x13a3f7732340003
- CASE WHEN 用法介绍
daizj
sqlgroup bycase when
CASE WHEN 用法介绍
1. CASE WHEN 表达式有两种形式
--简单Case函数
CASE sex
WHEN '1' THEN '男'
WHEN '2' THEN '女'
ELSE '其他' END
--Case搜索函数
CASE
WHEN sex = '1' THEN
- PHP技巧汇总:提高PHP性能的53个技巧
dcj3sjt126com
PHP
PHP技巧汇总:提高PHP性能的53个技巧 用单引号代替双引号来包含字符串,这样做会更快一些。因为PHP会在双引号包围的字符串中搜寻变量, 单引号则不会,注意:只有echo能这么做,它是一种可以把多个字符串当作参数的函数译注: PHP手册中说echo是语言结构,不是真正的函数,故把函数加上了双引号)。 1、如果能将类的方法定义成static,就尽量定义成static,它的速度会提升将近4倍
- Yii框架中CGridView的使用方法以及详细示例
dcj3sjt126com
yii
CGridView显示一个数据项的列表中的一个表。
表中的每一行代表一个数据项的数据,和一个列通常代表一个属性的物品(一些列可能对应于复杂的表达式的属性或静态文本)。 CGridView既支持排序和分页的数据项。排序和分页可以在AJAX模式或正常的页面请求。使用CGridView的一个好处是,当用户浏览器禁用JavaScript,排序和分页自动退化普通页面请求和仍然正常运行。
实例代码如下:
- Maven项目打包成可执行Jar文件
dyy_gusi
assembly
Maven项目打包成可执行Jar文件
在使用Maven完成项目以后,如果是需要打包成可执行的Jar文件,我们通过eclipse的导出很麻烦,还得指定入口文件的位置,还得说明依赖的jar包,既然都使用Maven了,很重要的一个目的就是让这些繁琐的操作简单。我们可以通过插件完成这项工作,使用assembly插件。具体使用方式如下:
1、在项目中加入插件的依赖:
<plugin>
- php常见错误
geeksun
PHP
1. kevent() reported that connect() failed (61: Connection refused) while connecting to upstream, client: 127.0.0.1, server: localhost, request: "GET / HTTP/1.1", upstream: "fastc
- 修改linux的用户名
hongtoushizi
linuxchange password
Change Linux Username
更改Linux用户名,需要修改4个系统的文件:
/etc/passwd
/etc/shadow
/etc/group
/etc/gshadow
古老/传统的方法是使用vi去直接修改,但是这有安全隐患(具体可自己搜一下),所以后来改成使用这些命令去代替:
vipw
vipw -s
vigr
vigr -s
具体的操作顺
- 第五章 常用Lua开发库1-redis、mysql、http客户端
jinnianshilongnian
nginxlua
对于开发来说需要有好的生态开发库来辅助我们快速开发,而Lua中也有大多数我们需要的第三方开发库如Redis、Memcached、Mysql、Http客户端、JSON、模板引擎等。
一些常见的Lua库可以在github上搜索,https://github.com/search?utf8=%E2%9C%93&q=lua+resty。
Redis客户端
lua-resty-r
- zkClient 监控机制实现
liyonghui160com
zkClient 监控机制实现
直接使用zk的api实现业务功能比较繁琐。因为要处理session loss,session expire等异常,在发生这些异常后进行重连。又因为ZK的watcher是一次性的,如果要基于wather实现发布/订阅模式,还要自己包装一下,将一次性订阅包装成持久订阅。另外如果要使用抽象级别更高的功能,比如分布式锁,leader选举
- 在Mysql 众多表中查找一个表名或者字段名的 SQL 语句
pda158
mysql
在Mysql 众多表中查找一个表名或者字段名的 SQL 语句:
方法一:SELECT table_name, column_name from information_schema.columns WHERE column_name LIKE 'Name';
方法二:SELECT column_name from information_schema.colum
- 程序员对英语的依赖
Smile.zeng
英语程序猿
1、程序员最基本的技能,至少要能写得出代码,当我们还在为建立类的时候思考用什么单词发牢骚的时候,英语与别人的差距就直接表现出来咯。
2、程序员最起码能认识开发工具里的英语单词,不然怎么知道使用这些开发工具。
3、进阶一点,就是能读懂别人的代码,有利于我们学习人家的思路和技术。
4、写的程序至少能有一定的可读性,至少要人别人能懂吧...
以上一些问题,充分说明了英语对程序猿的重要性。骚年
- Oracle学习笔记(8) 使用PLSQL编写触发器
vipbooks
oraclesql编程活动Access
时间过得真快啊,转眼就到了Oracle学习笔记的最后个章节了,通过前面七章的学习大家应该对Oracle编程有了一定了了解了吧,这东东如果一段时间不用很快就会忘记了,所以我会把自己学习过的东西做好详细的笔记,用到的时候可以随时查找,马上上手!希望这些笔记能对大家有些帮助!
这是第八章的学习笔记,学习完第七章的子程序和包之后