python 如何画多Y轴图
如何画多Y轴图
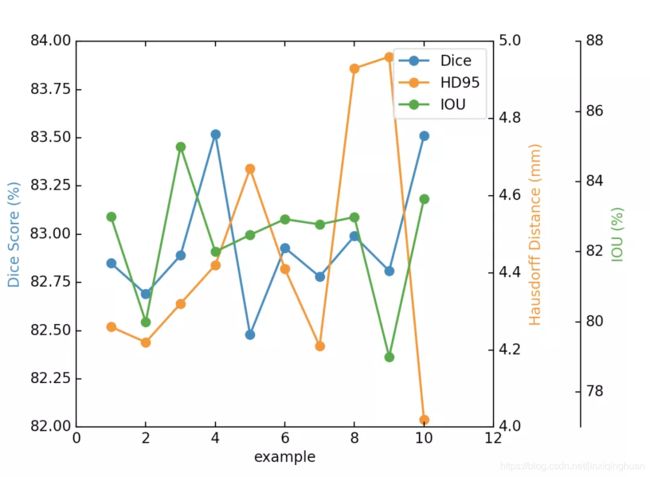
如图,我们想把每个例子的多个指标(Dice, HD, IOU)画在同一个图中,应该怎么操作呢
使用到的工具是:matplotlib (Version: 3.3.3)
```python
from mpl_toolkits.axes_grid1 import host_subplot
from mpl_toolkits import axisartist
import matplotlib.pyplot as plt

host = host_subplot(111, axes_class=axisartist.Axes)
plt.subplots_adjust(right=0.75)

par1 = host.twinx()
par2 = host.twinx()

par2.axis["right"] = par2.new_fixed_axis(loc="right", offset=(60, 0))

par1.axis["right"].toggle(all=True)
par2.axis["right"].toggle(all=True)

p1, = host.plot([1, 2, 3,4,5,6,7,8,9,10],[82.85,82.69,82.89,83.52,82.48,82.93,82.78,82.99,82.81,83.51], 'o-', label="Dice")
p2, = par1.plot([1, 2, 3,4,5,6,7,8,9,10], [4.26,4.22,4.32,4.42,4.67,4.41,4.21,4.93,4.96,4.02], 'o-', label="HD95")
p3, = par2.plot([1, 2, 3,4,5,6,7,8,9,10], [83,80,85,82,82.48,82.93,82.78,82.99,79,83.51], 'o-', label="IOU")

host.set_xlim(0, 12)   # 坐标轴长度
host.set_ylim(82, 84)
par1.set_ylim(4, 5)
par2.set_ylim(77, 88)

host.set_xlabel("example")
host.set_ylabel("Dice Score (%)")
par1.set_ylabel("Hausdorff Distance (mm)")
par2.set_ylabel("IOU (%)")

host.legend()

host.axis["left"].label.set_color(p1.get_color())
par1.axis["right"].label.set_color(p2.get_color())
par2.axis["right"].label.set_color(p3.get_color())

plt.show()
plt.plot()
注意,版本不同可能略有差异,导致跑不通

代码关键解析:

p1,p2,p3 后面的逗号不能省略
p1,p2,p3 代表不同的指标
*.set_xlim 设置坐标轴的显示范围,范围要能大到足够包含所有值
其余的就是一些美化设置