【Machine Learning 学习笔记】feature engineering 中不同特征处理方法比较以及sklearn中Lasso的使用
【Machine Learning 学习笔记】feature engineering 中不同特征处理方法比较以及sklearn中Lasso的使用
通过本篇博客记录一下使用不同方法对feature进行处理后进行监督学习的效果。特征选择(feature selection)使用sklearn的Lasso, 数据集使用sklearn的breast cancer。
数据准备
import numpy as np
import matplotlib.pyplot as plt
from sklearn.datasets import load_breast_cancer
from sklearn.linear_model import Lasso
from sklearn.metrics import accuracy_score

X_original, y_original = load_breast_cancer(return_X_y=True)
y_original[y_original==0] = -1
print("data shapes:", X_original.shape, y_original.shape)

# return_X_y=True is an easy option here if you just want to quickly apply ML algorithms
# with return_X_y=False, a pandas dataframe is returned instead
# in this dataframe there is more information about the data, for example the feature names:
bc_pandas_frame = load_breast_cancer(return_X_y=False)
print("\nfeature names:")
for ii in range(X_original.shape[1]):
    print(ii, bc_pandas_frame.feature_names[ii])

# divide into training and testing
np.random.seed(7)
order = np.random.permutation(len(y_original))
tr = np.sort(order[:250])
tst = np.sort(order[250:])

from collections import Counter
print("\nClasses in training: {}".format(Counter(y_original[tr])))
print("Classes in testing: {}".format(Counter(y_original[tst])))
print("Majority vote accuracy: {}".format(np.round(100*accuracy_score(y_original[tst],
                            np.sign(np.sum(y_original[tr]))*np.ones(len(tst))), 2)))
Classes in training: Counter({1: 169, -1: 81})
Classes in testing: Counter({1: 188, -1: 131})
Majority vote accuracy: 58.93
特征
breast cancer 数据集中总共有569条数据,每一条数据共30个features,如下:
feature names:
0 mean radius
1 mean texture
2 mean perimeter
3 mean area
4 mean smoothness
5 mean compactness
6 mean concavity
7 mean concave points
8 mean symmetry
9 mean fractal dimension
10 radius error
11 texture error
12 perimeter error
13 area error
14 smoothness error
15 compactness error
16 concavity error
17 concave points error
18 symmetry error
19 fractal dimension error
20 worst radius
21 worst texture
22 worst perimeter
23 worst area
24 worst smoothness
25 worst compactness
26 worst concavity
27 worst concave points
28 worst symmetry
29 worst fractal dimension
可视化折线图如下:
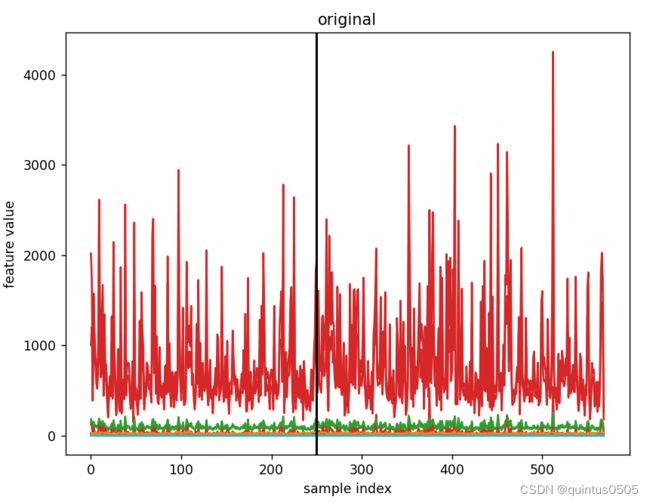
图中分割线左边为训练集,右边为测试集,在处理特征时只考虑训练集。
对原始数据集分别进行四种基本处理,有:
centering
减去训练集数据所有特征的均值,可以看见,仅有一个特征处理后仍然有一定区分度。
trmean = np.mean(X[tr, :], axis=0)
X = X - trmean[np.newaxis, :] # mean of each column

standardisation
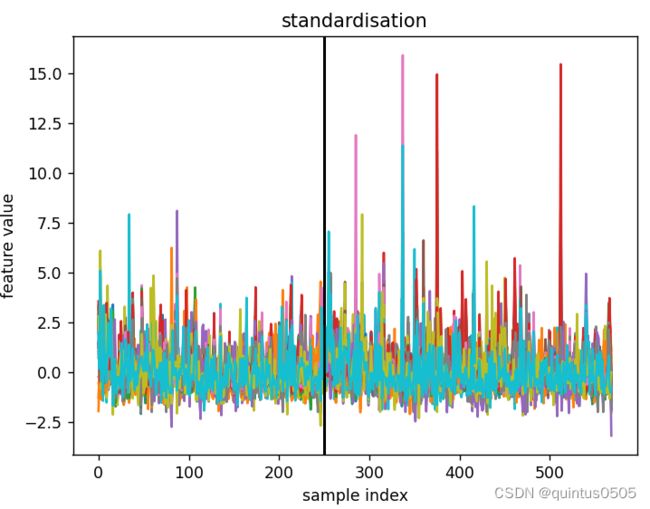
标准化,减去均值除以标准差,所有的特征的差别都得到了显著的缩小。
trmean = np.mean(X[tr, :], axis=0)
trvar = np.var(X[tr, :], axis=0)
X = (X - trmean[np.newaxis, :]) / np.sqrt(trvar)[np.newaxis, :]
title_str = 'standardisation'
unit range
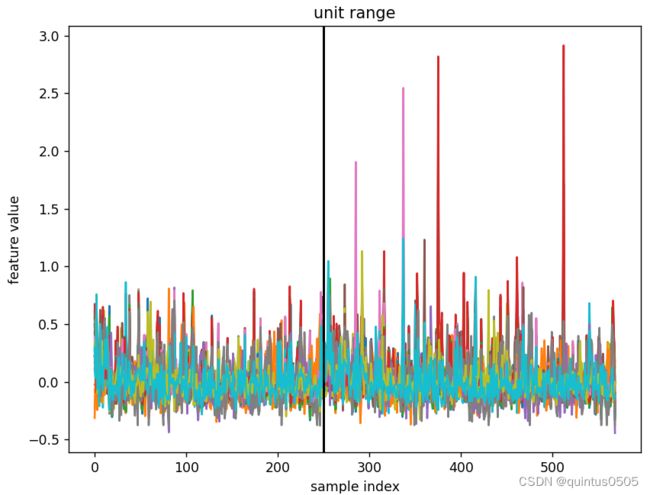
除以最大值与最小值的差,和标准化的结果相似。
trmax = np.max(X[tr, :], axis=0)
trmin = np.min(X[tr, :], axis=0)
X = (X - trmean[np.newaxis, :]) / (trmax - trmin)[np.newaxis, :]
title_str = 'unit range'
normalization
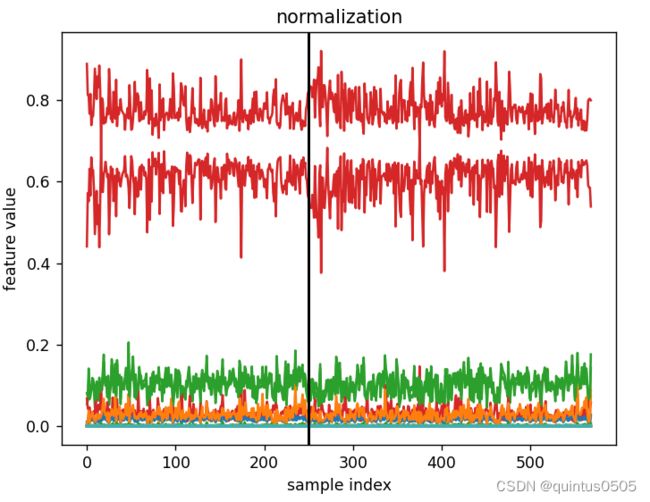
归一化,处理后有还剩两个明显特征。
X = X / np.linalg.norm(X, axis=1)[:, np.newaxis]
title_str = 'normalization'
训练
利用Lasso拟合经过不同特征处理的数据并得出结果,这里对lasso的参数随机初始化并依次使用。这里使用np.count_nonzero(lasso.coef_)来判断使用了多少个特征。
for n_lasso_params in [50]: # [50, 100, 250, 500, 1000, 5000, 10000]
    print("*"*50)
    # print(n_lasso_params, "parameteres for Lasso")

    params = np.logspace(-6, 1, n_lasso_params, endpoint=True)

    plt.figure()

    for ii in range(5):

        X = np.copy(X_original)
        y = np.copy(y_original)
        title_str = 'original'

        # centering
        if ii == 1:
            trmean = np.mean(X[tr, :], axis=0)
            X = X - trmean[np.newaxis, :] # mean of each column
            title_str = 'centering'
        # standardisation
        elif ii == 2:
            trmean = np.mean(X[tr, :], axis=0)
            trvar = np.var(X[tr, :], axis=0)
            X = (X - trmean[np.newaxis, :]) / np.sqrt(trvar)[np.newaxis, :]
            title_str = 'standardisation'
        # unit range
        elif ii == 3:
            trmax = np.max(X[tr, :], axis=0)
            trmin = np.min(X[tr, :], axis=0)
            X = (X - trmean[np.newaxis, :]) / (trmax - trmin)[np.newaxis, :]
            title_str = 'unit range'
        # normalization
        elif ii == 4:
            X = X / np.linalg.norm(X, axis=1)[:, np.newaxis]
            title_str = 'normalization'

        # lasso classification

        print()
        print(title_str)

        accs = []
        n_feats = []
        # go through all the params that are chosen to be investigated
        for param in params:
            # fit the Lasso model, obtain predictions on the test set
            lasso = Lasso(alpha=param, tol=1e-3, max_iter=int(1e5))
            lasso.fit(X[tr, :], y[tr])
            preds = lasso.predict(X[tst, :])
            # count how many features are selected
            if np.count_nonzero(lasso.coef_) > 0:
                theacc = accuracy_score(y[tst], np.sign(preds))
                number_of_features = np.count_nonzero(lasso.coef_)
                # if there are multiple results with same sparsity (number of features), consider only the highest
                if number_of_features not in n_feats:
                    accs.append(theacc)
                    n_feats.append(number_of_features)
                else:
                    n_feat_index = np.where(np.array(n_feats) == number_of_features)[0][0]
                    if accs[n_feat_index] < theacc:
                        accs[n_feat_index] = theacc

        accs = np.array(accs) * 100
        n_feats = np.array(n_feats)

        # sort for  plotting
        order = np.argsort(n_feats)
        n_feats = n_feats[order]
        accs = accs[order]

        print()

        plt.subplot(231 + ii)
        # plot sparsity vs accuracy
        plt.plot(n_feats, accs, marker='.')

        # print accuracy with one feature:
        print(title_str + " accuracy with " + str(np.min(n_feats)) + " feature:", accs[np.argmin(n_feats)])

        # check with how many features over 90% accuracy is abtained
        inds = np.where(accs > 90)[0]
        if len(inds) > 0:
            # highlight with red accuracies over 90 in the plot
            plt.plot(n_feats[inds], accs[inds], c='r', marker='x', markersize=4)
            print("the minimum amount of feature used in " + title_str + "to achieve accuracy over 90%:", np.min(n_feats[inds]))
        else:
            print("the minimum amount of feature used in " + title_str + "to achieve accuracy over 90%: -")

        plt.xlabel("features")
        plt.ylabel("accuracy")
        plt.ylim((50, 100))
        plt.xlim((-1, 30))
        plt.tight_layout()
        plt.title(title_str)

plt.show()
结果与分析
输出结果如下,对比包括不进行特征处理的五种情况中只使用一种feature得到的最高准确率和实现大于90%准确率所需最少的特征。
original

original accuracy with 1 feature: 87.7742946708464
the minimum amount of feature used in originalto achieve accuracy over 90%: 5

centering

centering accuracy with 1 feature: 87.7742946708464
the minimum amount of feature used in centeringto achieve accuracy over 90%: 5

standardisation

standardisation accuracy with 1 feature: 58.93416927899686
the minimum amount of feature used in standardisationto achieve accuracy over 90%: 5

unit range

unit range accuracy with 1 feature: 75.23510971786834
the minimum amount of feature used in unit rangeto achieve accuracy over 90%: 3

normalization

normalization accuracy with 1 feature: 69.90595611285266
the minimum amount of feature used in normalizationto achieve accuracy over 90%: 2
通过绘图更加直观提现针对当前数据集经过不同的特征处理方法后使用不同数量特征能够实现的最高准确率:
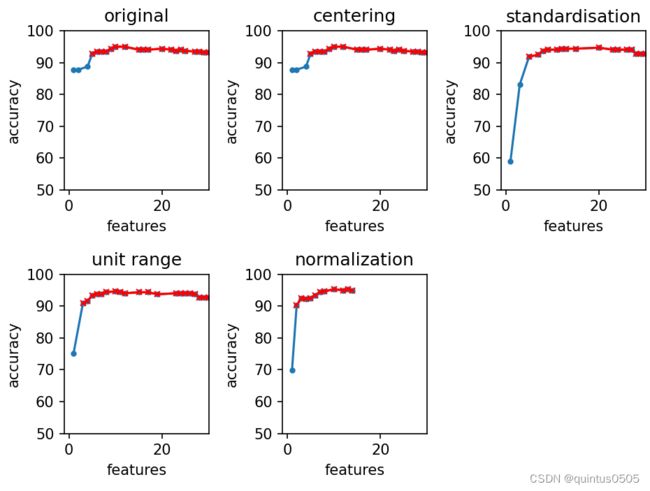
可以看到,当只有一个特征被选择时,原始的数据集和仅仅减去均值的处理最有效,若需要准确率大于90%,针对当前数据集对特征归一化最有效,仅仅只需要两个特征。