函数插值生成波动率曲面
代码基本都是改自优矿,但是因为有几个地方要解释一下,还是贴上来。还是涵盖了一些蛮基本的技巧。
期权价格一般以隐含波动率的形式报出。
站在现在3月3日的时间节点上,可以看到未来date(2015,3,25), date(2015,4,25), date(2015,6,25), date(2015,9,25)几个时间节点的strike price以及对应的波动率——波动率矩阵(行为maturity,列为strike)
#全部代码:
import pandas as pd
import numpy as np
from datetime import *
from scipy import interpolate
from matplotlib import pylab
#市场上期权价格一般以隐含波动率的形式报出,一般来讲在市场交易时间,交易员可以看到类似的波动率矩阵(Volatilitie Matrix):
pd.options.display.float_format='{:,>.2f}'.format
dates=[date(2015,3,25), date(2015,4,25), date(2015,6,25), date(2015,9,25)]
strikes=[2.2, 2.3, 2.4, 2.5, 2.6]
blackVolMatrix=np.array([[ 0.32562851,  0.29746885,  0.29260648,  0.27679993],
                  [ 0.28841840,  0.29196629,  0.27385023,  0.26511898],
                  [ 0.27659511,  0.27350773,  0.25887604,  0.25283775],
                  [ 0.26969754,  0.25565971,  0.25803327,  0.25407669],
                  [ 0.27773032,  0.24823248,  0.27340796,  0.24814975]])

table=pd.DataFrame(blackVolMatrix*100,index=strikes,columns=dates)
table.index.name='Strike Price'
table.columns.name='Maturity Date'
print table
----------


Maturity Date  2015-03-25  2015-04-25  2015-06-25  2015-09-25
Strike Price
2.20                32.56       29.75       29.26       27.68
2.30                28.84       29.20       27.39       26.51
2.40                27.66       27.35       25.89       25.28
2.50                26.97       25.57       25.80       25.41
2.60 27.77 24.82 27.34 24.81- 我们并不是直接在波动率上进行插值,而是在方差矩阵上面进行插值
Var(K,T)=σ(K,T)2T
其中datetime的(d-currentTime).days用来提取两个日前间的天数
通过ttm把日期转换为time-to-maturity,
varianceMatrix=(blackVolMatrix**2)*ttm 得到方差矩阵
#交易员可以看到市场上离散值的信息,但是如果可以获得一些隐含的信息更好:例如,在2015年6月25日以及2015年9月25日之间,波动率的形状会是怎么样的?
#我们并不是直接在波动率上进行插值,而是在方差矩阵上面进行插值
#所以下面我们将通过处理,获取方差矩阵(Variance Matrix)

currentTime=date(2015,3,3)
print date(2015,3,25)- date(2015,4,25)

ttm=np.array([(d-currentTime).days/365.0 for d in dates])
varianceMatrix=(blackVolMatrix**2)*ttm

print strikes
print varianceMatrix
----------


[[ 0.00639109  0.0128489   0.02674114  0.04324205]
 [ 0.0050139   0.01237794  0.02342277  0.03966943]
 [ 0.00461125  0.01086231  0.02093128  0.03607931]
 [ 0.00438413  0.0094909   0.02079521  0.03643376]
[ 0.00464918 0.00894747 0.02334717 0.03475378]]- 插值的主函数
interp=interpolate.interp2d(ttm,strikes,varianceMatrix,kind='linear') class scipy.interpolate.interp2d(x, y, z, kind=’linear’, copy=True, bounds_error=False, fill_value=nan)[source]
z : array_like The values of the function to interpolate at the data
points. If z is a multi-dimensional array, it is flattened before use.
The length of a flattened z array is either len(x)*len(y) if x and y
specify the column and row coordinates or len(z) == len(x) == len(y)
if x and y specify coordinates for each point.
'''
ttm 时间方向离散点
strikes 行权价方向离散点
varianceMatrix 方差矩阵,列对应时间维度;行对应行权价维度
kind = 'linear' 指示插值以线性方式进行
'''

#下面我们将在行权价方向以及时间方向同时进行线性插值
#这个过程在scipy中可以直接通过interpolate模块下interp2d来实现

interp=interpolate.interp2d(ttm,strikes,varianceMatrix,kind='linear')

smeshes=np.linspace(strikes[0],strikes[-1],500)
tmeshes=np.linspace(ttm[0],ttm[-1],400)
interpolatedVarSurface=np.zeros((len(smeshes),len(tmeshes)))
for i,s in enumerate (smeshes):
    for j,t in enumerate (tmeshes):
        interpolatedVarSurface[i][j]=interp(t,s)  #注意这里的写法,t和s的顺序尤其重要
interpolatedVolSurface=np.sqrt((interpolatedVarSurface/tmeshes))

'''
print np.size(interpolatedVolSurface,0)
print np.size(interpolatedVolSurface,1)  #如果前面有中文字,IDE可能会报错
print interp(0,0)
print interp(5,0)
print interp(10,0)
print interp(-1,0)
print interpolatedVarSurface[0][0]
print interpolatedVarSurface[5][0]
print interpolatedVarSurface[10][0]
print interpolatedVarSurface[-1][0]
'''
- 注
interp出来的格式是
[ 0.00639109] [ 0.04324205] [ 0.04324205] [ 0.00639109]
要把它装到interpolatedVarSurface,出来的格式是
0.00639108598232
0.00633588818206
0.00628069038181
0.00464918047737
通过:
for i,s in enumerate (smeshes):
    for j,t in enumerate (tmeshes):
interpolatedVarSurface[i][j]=interp(t,s)- 制图
pylab.figure(figsize=(12,8))
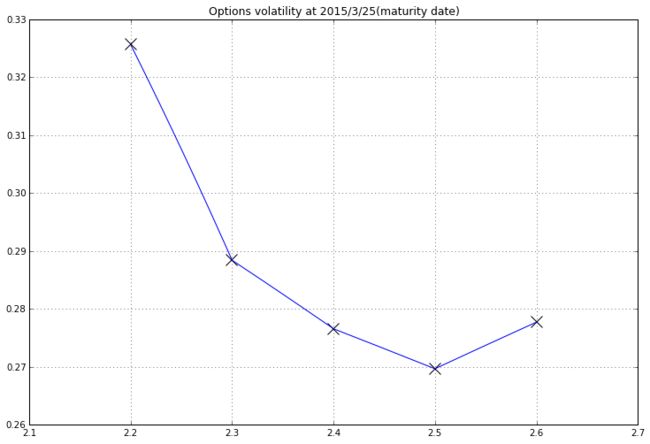
pylab.plot(smeshes,interpolatedVolSurface[:,0],color='b')
pylab.scatter(x=strikes,y=blackVolMatrix[:,0],color='k',marker='x',s=160)
pylab.grid(True)
pylab.title("Options volatility at 2015/3/25(maturity date)" )
from mpl_toolkits.mplot3d import Axes3D
from matplotlib import cm

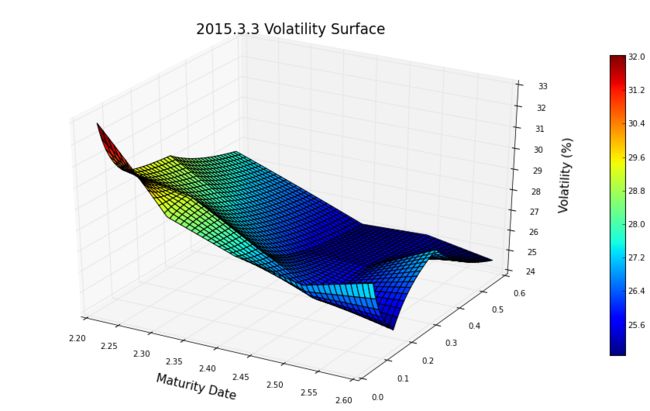
pylab.figure(figsize=(16,9))
ax=pylab.gca(projection='3d')

Maturitymeshes,Strikemeshes=np.meshgrid(tmeshes,smeshes)
surface=ax.plot_surface(Strikemeshes,Maturitymeshes,interpolatedVolSurface*100,cmap=cm.jet)
pylab.colorbar(surface,shrink=0.75)
pylab.title('2015.3.3 Volatility Surface',fontsize=18)
pylab.xlabel('Strike Price',fontsize=15)
pylab.xlabel('Maturity Date',fontsize=15)
ax.set_zlabel('Volatility (%)',fontsize=15)
