yolo-fast模型下anchor的使用
- 关于yolo 模型中anchors值的理解:
anchor box就是从训练集中真实框(ground truth)中统计或聚类得到的几个不同尺寸的框。避免模型在训练的时候瞎找,有助于模型快速收敛。假设每个网格对应k个anchor,也就是模型在训练的时候,它只是会在每一个网格附近找出这k种形状,不会找其他的。anchor的设置其实就是对预测的对象范围进行约束,并加入了尺寸先验经验,从而实现多尺度学习的目的。
anchor box的生成:yolo网络中使用k-means算法在训练集中所有样本的真实框(ground truth)中聚类,得到具有代表性形状的宽高(维度聚类)。但是具体几个anchor才是最合适的,作者采用实验的方式,分别用不同数量的anchor应用到模型,然后在模型的复杂度和高召回率之间折中找到最优的那组anchor box,最终得出N个anchor box最佳。
- yolo-fast网络中的get_region_box函数使用anchor值:
首先是模型在训练时得出的anchor box的值,分为6组;
// # 模型训练时设置的anchor_box比例
// BIAS_W = [26, 67, 72, 189, 137, 265]
// BIAS_H = [48, 84, 175, 126, 236, 259]
float VOC[12]={26, 67, 72, 189, 137 , 265, 48, 84, 175, 126, 236, 259};
对于yolo-fast模型,其输出有两个,维度分别对应为1*10*10*75和1*20*20*75,很容易看出这两个输出应该是后者比前者更适合检测小目标物体,那么在应用anchor值的时候,应该是两个输出分别对应三组anchor box的值,那么根据yolov3模型感受野与anchor box的对应情况上来分析,此处yolo-fast模型1*10*10*75是输出应该对应后面三组,即[189,126],[137,236],[265,259],更适合检测大目标,同理1*20*20*75是输出应该对应前面三组,即[26,48],[67,84],[72,175],更适合检测小目标,下面是我写的针对yolo-fast模型get_region_box函数的调用形式和函数原型:
float get_region_box(float *output, int offsetx , int offsety , float *box , float biasw , float biash)
{
    int w = 320, h = 320;
	int iw = 10, ih = 10;

	box[0] = ((float)offsetx + logistic(output[0])) / (float)iw * w;
    box[1] = ((float)offsety + logistic(output[1])) / (float)ih * h;
    box[2] = (std::exp(output[2]) * biasw / img_size_w) * (float)w;
    box[3] = (std::exp(output[3]) * biash / img_size_h) * (float)h;
}
get_region_box(output + i * 25, offset_x, offset_y, boxes + i * 4, VOC[l+3], VOC[l+9]);
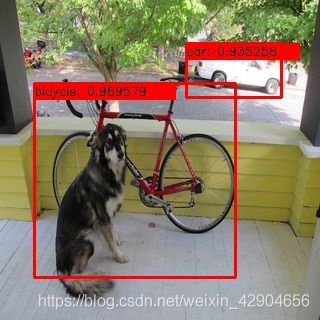
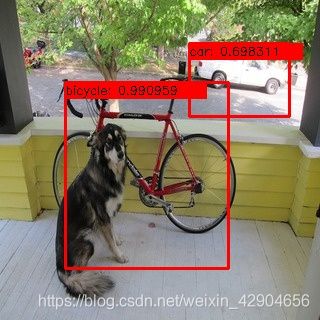
下面是我测试的用同一张图片测两个输出的绘制检测框的对比情况,20*20的输出好像画框的精确度更精准一点,其实他的优势在于小目标检测,我使用的图片可能不是很合适,像使用鸟群图片应该更直观。

