时序分析41 - 时序预测 TBATS模型
时序分析 41
时序预测 TBATS 模型
前面我们介绍了(S)ARIMA(X)系列模型、Prophet等方法来预测时序数据,本篇我们尝试使用TBATS模型进行时序预测。TBATS模型主要目标是用指数平滑的方式来对复杂季节因素进行建模。请看下图,
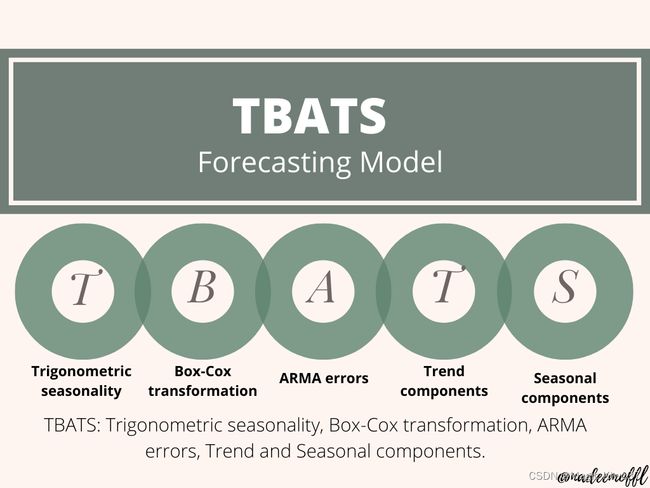
TBATS: Trigonometric seasonality, Box-Cox transformation, ARMA errors, Trend and Seasonal components.
简介
时序预测问题一般来说就是根据该时序数据的历史观测值来预测时序未来值。建模过程中经产会出现的一个令人头疼的问题就是时序的周期不确定,它因数据场景而变化。
而本文要介绍的TBATS模型主要是利用指数平滑的方法来解决复杂的周期问题。
TBATS会考虑不同的选择来对时序的周期进行建模,包括:
- 进行Box-Cox转换和不进行Box-Cox转换
- 考虑时序趋势和不考虑趋势
- 使用趋势衰减和不适用趋势衰减
- 对模型残差使用ARIMA(p,q)或者不使用
- 无季节性模型
- 对季节性因素进行不同程度的均衡
请看下图:

最后的模型选择采用赤池信息量(AIC, Akaike information criterion).
注意:自动ARIMA是用来确定残差是否需要建模或者找到合适的参数(p,q)。
简单例子
让我们先看一个最简单的例子
from tbats import TBATS
import numpy as np
# required on windows for multi-processing,
# see https://docs.python.org/2/library/multiprocessing.html#windows
if __name__ == '__main__':
    np.random.seed(2342)
    t = np.array(range(0, 160))
    y = 5 * np.sin(t * 2 * np.pi / 7) + 2 * np.cos(t * 2 * np.pi / 30.5) + \
        ((t / 20) ** 1.5 + np.random.normal(size=160) * t / 50) + 10

    # Create estimator
    estimator = TBATS(seasonal_periods=[14, 30.5])

    # Fit model
    fitted_model = estimator.fit(y)

    # Forecast 14 steps ahead
    y_forecasted = fitted_model.forecast(steps=14)

    # Summarize fitted model
    print(fitted_model.summary())
Use Box-Cox: True
Use trend: True
Use damped trend: True
Seasonal periods: [14. 30.5]
Seasonal harmonics [2 1]
ARMA errors (p, q): (0, 0)
Box-Cox Lambda 0.654044
Smoothing (Alpha): 0.132425
Trend (Beta): 0.023495
Damping Parameter (Phi): 0.947184
Seasonal Parameters (Gamma): [-9.18866163e-09 -4.37211750e-09 -1.04956292e-08 -1.81209981e-08]
AR coefficients []
MA coefficients []
Seed vector [ 5.69510575e+00 -1.36715628e-01 4.70120645e-04 4.91577774e-02
-3.14318406e-02 1.93662153e+00 6.22414387e-01 9.31711655e-02]
AIC 1028.837243
# Time series analysis
print(fitted_model.y_hat) # in sample prediction
print(fitted_model.resid) # in sample residuals
print(fitted_model.aic)
[12.00026315 15.37130609 15.92513946 12.92209113 8.86829808 6.55044357
6.98379669 9.80510678 12.96461526 13.46459656 10.73401852 6.96869927
4.88388936 5.2411647 7.89921391 11.16766831 12.01242589 9.84585836
6.61337902 4.99937038 5.90163047 9.22357233 13.21064516 14.63622867
12.54077865 9.32236216 7.62704064 8.86253335 12.72529442 16.732014
17.97565652 15.35674111 11.53204899 9.35938536 10.22652865 13.76843469
…
[-2.63150260e-04 4.92298548e-01 7.81058008e-01 1.04674185e+00
4.74485095e-01 -2.89650437e-01 -1.09380563e-02 7.11659349e-01
7.52445725e-01 1.52818057e+00 7.74776582e-01 2.21684967e-01
-1.03614988e+00 -3.83613709e-01 1.26200022e+00 1.11129016e+00
2.11411936e+00 9.74278300e-01 5.82900889e-01 -3.77720695e-01
-1.42384359e-01 1.28154205e+00 1.23632142e+00 9.87393000e-01
1.61135725e+00 5.23587924e-01 3.71403105e-01 4.83700871e-01
…
1028.8372428992702
# Reading model parameters
print(fitted_model.params.alpha)
print(fitted_model.params.beta)
print(fitted_model.params.x0)
print(fitted_model.params.components.use_box_cox)
print(fitted_model.params.components.seasonal_harmonics)
0.13242488070375835
0.023495267045578822
[ 5.69510575e+00 -1.36715628e-01 4.70120645e-04 4.91577774e-02
-3.14318406e-02 1.93662153e+00 6.22414387e-01 9.31711655e-02]
True
[2 1]
复杂一点儿的例子
我们依然使用前面SARIMAX系列博文中使用的数据,该数据是一份日销量数据,包含5年10个仓储中50个产品的销售数据。本例中我们使用仓储1中的产品1相关数据。
import pandas as pd
df = pd.read_csv('walmart/train.csv')
df = df[(df['store'] == 1) & (df['item'] == 1)] # item 1 in store 1
df = df.set_index('date')
y = df['sales']
y_to_train = y.iloc[:(len(y)-365)]
y_to_test = y.iloc[(len(y)-365):] # last year for testing

我们从图中看到了周周期和年周期性,这说明该时序中含有多个周期
TBATS模型
from tbats import TBATS, BATS # Fit the model
estimator = TBATS(seasonal_periods=(7, 365.25))
model = estimator.fit(y_to_train)# Forecast 365 days ahead
y_forecast = model.forecast(steps=365)
注意年周期定义为365,25,并不是一个整数,但没有关系,TBATS模型是可以支持的。
看上去,TBATS模型对于两种混杂在一起的周期性拟合的不错。

年周期性拟合情况

周周期性拟合情况
模型参数如下:
Use Box-Cox: True
Use trend: False
Use damped trend: False
Seasonal periods: [ 7. 365.25]
Seasonal harmonics [ 3 11]
ARMA errors (p, q): (0, 0)
Box-Cox Lambda 0.234955
Smoothing (Alpha): 0.015789
TBATS对周周期性使用了三个均衡策略,对于年周期性使用了11个均衡策略;同时采用了Box-Cox方法,lambda为0.234955;并没有对趋势建模,也没有使用ARMA对残差建模。
SARIMA对周周期性建模
SARIMA只能对单周期进行建模,而且周期不能太长。我们来尝试使用SARIMA对该时序数据建模,可以与TBATS比较一下。
from pmdarima import auto_arima
arima_model = auto_arima(y_to_train, seasonal=True, m=7)
y_arima_forecast = arima_model.predict(n_periods=365)
Autoarima选择了SARIMA(0, 1, 1)x(1, 0, 1, 7) model,年周期性并没有被建模。

SARIMAX + 傅里叶项
我们可以使用SARIMAX模型,以傅里叶项作为外部变量来去拟合第二个周期因素。
# prepare Fourier terms
exog = pd.DataFrame({'date': y.index})
exog = exog.set_index(pd.PeriodIndex(exog['date'], freq='D'))
exog['sin365'] = np.sin(2 * np.pi * exog.index.dayofyear / 365.25)
exog['cos365'] = np.cos(2 * np.pi * exog.index.dayofyear / 365.25)
exog['sin365_2'] = np.sin(4 * np.pi * exog.index.dayofyear / 365.25)
exog['cos365_2'] = np.cos(4 * np.pi * exog.index.dayofyear / 365.25)
exog = exog.drop(columns=['date'])
exog_to_train = exog.iloc[:(len(y)-365)]
exog_to_test = exog.iloc[(len(y)-365):]# Fit model
arima_exog_model = auto_arima(y=y_to_train, exogenous=exog_to_train, seasonal=True, m=7)# Forecast
y_arima_exog_forecast = arima_exog_model.predict(n_periods=365, exogenous=exog_to_test)
这里采用了两个傅里叶项来作为外部变量。现在SARIMAX模型对两种周期性因素完成了建模。

模型比较
我们使用Mean Absolute Error比较三种模型:
TBATS: 3.8527
SARIMA:7.2249
SARIMAX + 2 傅里叶项:3.9045
优缺点
优点
TBATS模型可以对复杂的周期性因素进行建模,诸如非整数周期、长周期等。
缺点
由于TBATS模型在底层混合和尝试了多种方法,所以其计算速度比较慢。
TBATS模型不能像SARIMAX那样增加外部变量。