基于支持向量机的实验分析
文章目录
- 一、支持向量机
-
- 1、支持向量机的效果
- 2、软间隔
- 二、非线性支持向量机
- 三、核函数
- 四、参考文献
一、支持向量机
1、支持向量机的效果
选择鸢尾花数据集的其中两个特征,并且只对“SETOSA”和“VERSICOLOR”这两类进行SVM分类,代码如下:
from sklearn.svm import SVC
from sklearn import datasets

iris = datasets.load_iris()
X = iris['data'][:,(2,3)]
y = iris['target']

setosa_or_versicolor = (y==0)|(y==1)
X = X[setosa_or_versicolor]
y = y[setosa_or_versicolor]

svm_clf = SVC(kernel='linear',C=float('inf'))
svm_clf.fit(X,y)
我们将SVM与逻辑回归等分类器进行对比,代码如下所示:
x0 = np.linspace(0, 5.5, 200)
# 1、逻辑回归
from sklearn.linear_model import LogisticRegression
log_res = LogisticRegression(C=0.01)
log_res.fit(X,y)
pred_1 = (-log_res.coef_[0][0] * x0 - log_res.intercept_[0]) / log_res.coef_[0][1]
# 2、自己取的决策边界
pred_2 = x0 - 1.8
pred_3 = 0.1 * x0 + 0.5

def plot_svc_decision_boundary(svm_clf, xmin, xmax,sv=True):
    w = svm_clf.coef_[0]        # 权重参数
    b = svm_clf.intercept_[0]   # 偏置参数
    x0 = np.linspace(xmin,xmax,200)
    decision_boundary = -w[0]/w[1] * x0-b/w[1]  # 决策边界
    margin = 1/w[1]         # 距离
    # 支持向量
    gutter_up = decision_boundary + margin
    gutter_down = decision_boundary - margin
    if sv:
        svs = svm_clf.support_vectors_
        plt.scatter(svs[:,0],svs[:,1],s=180,facecolors='#FFAAAA')
    plt.plot(x0,decision_boundary,'k-',linewidth=2)
    plt.plot(x0,gutter_up,'k--',linewidth=2)
    plt.plot(x0,gutter_down,'k--',linewidth=2)
plt.figure(figsize=(14,4))
plt.subplot(121)
plt.plot(X[:,0][y==1],X[:,1][y==1],'bs')
plt.plot(X[:,0][y==0],X[:,1][y==0],'ys')
plt.plot(x0,pred_1,'g--',linewidth=2)
plt.plot(x0,pred_2,'m-',linewidth=2)
plt.plot(x0,pred_3,'r-',linewidth=2)
plt.axis([0,5.5,0,2])

plt.subplot(122)
plot_svc_decision_boundary(svm_clf,0,5.5)
plt.plot(X[:,0][y==1],X[:,1][y==1],'bs')
plt.plot(X[:,0][y==0],X[:,1][y==0],'ys')
plt.axis([0,5.5,0,2])
得出的决策边界如下图所示:

其中左图为对比模型,右图为SVM模型。可以看出,SVM分类器分类的效果更好。
2、软间隔
为了解决硬间隔分类器容易受少数噪声点控制的问题,引入了软间隔分类器。接下来将对比超参数C值的取值对结果的影响。
首先进行数据处理,将鸢尾花数据集的“SETOSA”和“VERSICOLOR”归为一类,“VIGINICA”归为另一类。
import numpy as np
from sklearn import datasets
from sklearn.pipeline import Pipeline
from sklearn.preprocessing import StandardScaler
from sklearn.svm import LinearSVC

iris=datasets.load_iris()
X = iris["data"][:,(2,3)] # petal length, petal width
y = (iris["target"] == 2).astype(np.float64) # Iris-Viginica
其次,训练不同C值下的SVM分类器。
scaler = StandardScaler()
svm_clf1 = LinearSVC(C=1,random_state = 42)
svm_clf2 = LinearSVC(C=100,random_state = 42)

scaled_svm_clf1 = Pipeline((
    ('std',scaler),
    ('linear_svc',svm_clf1)
))

scaled_svm_clf2 = Pipeline((
    ('std',scaler),
    ('linear_svc',svm_clf2)
))
scaled_svm_clf1.fit(X,y)
scaled_svm_clf2.fit(X,y)
最后,求出最终的决策边界,并进行可视化展示。
b1 = svm_clf1.decision_function([-scaler.mean_ / scaler.scale_])
b2 = svm_clf2.decision_function([-scaler.mean_ / scaler.scale_])
w1 = svm_clf1.coef_[0] / scaler.scale_
w2 = svm_clf2.coef_[0] / scaler.scale_
svm_clf1.intercept_ = np.array([b1])
svm_clf2.intercept_ = np.array([b2])
svm_clf1.coef_ = np.array([w1])
svm_clf2.coef_ = np.array([w2])

plt.figure(figsize=(14,4.2))
plt.subplot(121)
plt.plot(X[:, 0][y==1], X[:, 1][y==1], "g^", label="Iris-Virginica")
plt.plot(X[:, 0][y==0], X[:, 1][y==0], "bs", label="Iris-Versicolor")
plot_svc_decision_boundary(svm_clf1, 4, 6,sv=False)
plt.xlabel("Petal length", fontsize=14)
plt.ylabel("Petal width", fontsize=14)
plt.legend(loc="upper left", fontsize=14)
plt.title("$C = {}$".format(svm_clf1.C), fontsize=16)
plt.axis([4, 6, 0.8, 2.8])

plt.subplot(122)
plt.plot(X[:, 0][y==1], X[:, 1][y==1], "g^")
plt.plot(X[:, 0][y==0], X[:, 1][y==0], "bs")
plot_svc_decision_boundary(svm_clf2, 4, 6,sv=False)
plt.xlabel("Petal length", fontsize=14)
plt.title("$C = {}$".format(svm_clf2.C), fontsize=16)
plt.axis([4, 6, 0.8, 2.8])
plt.show()
结果图如下:
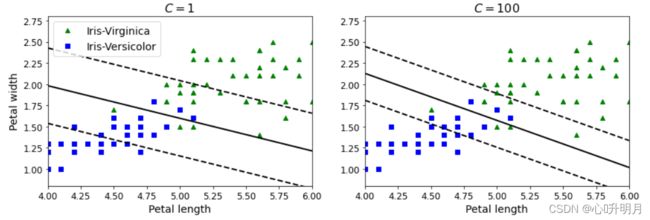
可以看出:
在右图,使用较高的C值,分类器会减少误分类,但最终会有较小间隔。
在左图,使用较低的C值,间隔要大得多,但很多实例最终会出现在间隔之内。
换言之,较大的C值会容忍更小的错误,但存在过拟合的风险;较小的C值会容忍更大的错误,间隔更大。
二、非线性支持向量机
我们可以利用sklearn中提供的PolynomialFeatures库进行非线性分类。
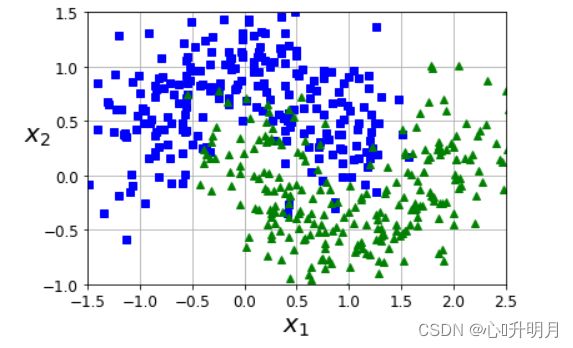
首先,利用make_moons生成500个二类点。散点图如下所示:
from sklearn.datasets import make_moons
X, y = make_moons(n_samples=500, noise=0.3, random_state=42)

def plot_dataset(X, y, axes):
    plt.plot(X[:, 0][y==0], X[:, 1][y==0], "bs")
    plt.plot(X[:, 0][y==1], X[:, 1][y==1], "g^")
    plt.axis(axes)
    plt.grid(True, which='both')
    plt.xlabel(r"$x_1$", fontsize=20)
    plt.ylabel(r"$x_2$", fontsize=20, rotation=0)

plot_dataset(X, y, [-1.5, 2.5, -1, 1.5])
plt.show()
from sklearn.datasets import make_moons
from sklearn.pipeline import Pipeline
from sklearn.preprocessing import PolynomialFeatures

polynomial_svm_clf=Pipeline((("poly_features",PolynomialFeatures(degree=3)),
                            ("scaler",StandardScaler()),
                            ("svm_clf",LinearSVC(C=10,loss="hinge"))
                            ))

polynomial_svm_clf.fit(X,y)

def plot_predictions(clf,axes):
    x0s = np.linspace(axes[0],axes[1],100)
    x1s = np.linspace(axes[2],axes[3],100)
    x0,x1 = np.meshgrid(x0s,x1s)
    X = np.c_[x0.ravel(),x1.ravel()]
    y_pred = clf.predict(X).reshape(x0.shape)
    plt.contourf(x0,x1,y_pred,cmap=plt.cm.brg,alpha=0.2)

plot_predictions(polynomial_svm_clf,axes=[-2.5,2.5,-1,1.5])
plot_dataset(X,y,[-1.5,2.5,-1,1.5])
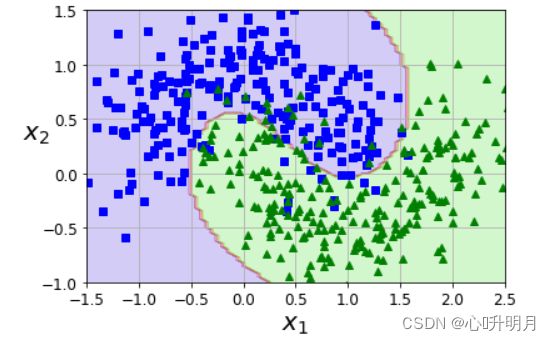
可以看出,非线性SVM将特征点给分开了,但这种方法容易过拟合,而且计算复杂度也会随着非线性的增长而增加。
由此,利用SVM中的核函数技巧来处理线性不可分数据是常用的方法。
三、核函数
核函数中最常用的就是高斯核函数:利用相似度来变换特征。
例如:选择一份一维数据集,并在 x 1 = − 2 x_1 = -2 x1=−2和 x 1 = 1 x_1 = 1 x1=1处为其添加两个高斯函数。接下来,将相似度函数定义为 γ = 0.3 \gamma= 0.3 γ=0.3的径向基函数(RBF): ϕ γ ( x , l ) = exp ( − γ ∣ ∣ x − l ∣ ∣ 2 ) (1) \phi\gamma(x,l)=\exp\left(-\gamma||\boldsymbol x-l||^2\right)\tag{1} ϕγ(x,l)=exp(−γ∣∣x−l∣∣2)(1)假设在 [ − 4.5 , 4.5 ] [-4.5,4.5] [−4.5,4.5]之间均匀分成200个点,显然这些点在一维空间下线性不可分,因此利用RBF函数将其映射到二维空间后,线性可分。代码如下:
def gaussian_rbf(x, landmark, gamma):
    return np.exp(-gamma * np.linalg.norm(x - landmark, axis=1)**2)

gamma = 0.3
X1D = np.linspace(-4, 4, 9).reshape(-1, 1)
x1s = np.linspace(-4.5, 4.5, 200).reshape(-1, 1)
x2s = gaussian_rbf(x1s, -2, gamma)
x3s = gaussian_rbf(x1s, 1, gamma)

XK = np.c_[gaussian_rbf(X1D, -2, gamma), gaussian_rbf(X1D, 1, gamma)]
yk = np.array([0, 0, 1, 1, 1, 1, 1, 0, 0])

svm_clf = SVC(kernel='linear',C=float('inf'))
svm_clf.fit(XK,yk)


plt.figure(figsize=(11, 4))

plt.subplot(121)
plt.grid(True, which='both')
plt.axhline(y=0, color='k')
plt.scatter(x=[-2, 1], y=[0, 0], s=150, alpha=0.5, c="red")
plt.plot(X1D[:, 0][yk==0], np.zeros(4), "bs")
plt.plot(X1D[:, 0][yk==1], np.zeros(5), "g^")
plt.plot(x1s, x2s, "g--")
plt.plot(x1s, x3s, "b:")
plt.gca().get_yaxis().set_ticks([0, 0.25, 0.5, 0.75, 1])
plt.xlabel(r"$x_1$", fontsize=20)
plt.ylabel(r"Similarity", fontsize=14)
plt.annotate(r'$\mathbf{x}$',
             xy=(X1D[3, 0], 0),
             xytext=(-0.5, 0.20),
             ha="center",
             arrowprops=dict(facecolor='black', shrink=0.1),
             fontsize=18,
            )
plt.text(-2, 0.9, "$x_2$", ha="center", fontsize=20)
plt.text(1, 0.9, "$x_3$", ha="center", fontsize=20)
plt.axis([-4.5, 4.5, -0.1, 1.1])

plt.subplot(122)
plt.grid(True, which='both')
plt.axhline(y=0, color='k')
plt.axvline(x=0, color='k')
plt.plot(XK[:, 0][yk==0], XK[:, 1][yk==0], "bs")
plt.plot(XK[:, 0][yk==1], XK[:, 1][yk==1], "g^")
plt.xlabel(r"$x_2$", fontsize=20)
plt.ylabel(r"$x_3$  ", fontsize=20, rotation=0)
plt.annotate(r'$\phi\left(\mathbf{x}\right)$',
             xy=(XK[3, 0], XK[3, 1]),
             xytext=(0.65, 0.50),
             ha="center",
             arrowprops=dict(facecolor='black', shrink=0.1),
             fontsize=18,
            )
plot_svc_decision_boundary(svm_clf, -4.5, 4.5,sv=True)
plt.axis([-0.1, 1.1, -0.1, 1.1])

plt.subplots_adjust(right=1)

plt.show()
效果图如下:
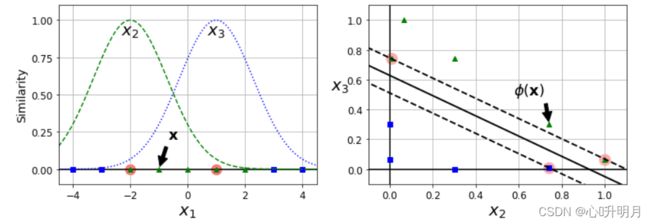
SVM中利用了核函数的计算技巧,大大降低了计算复杂度:
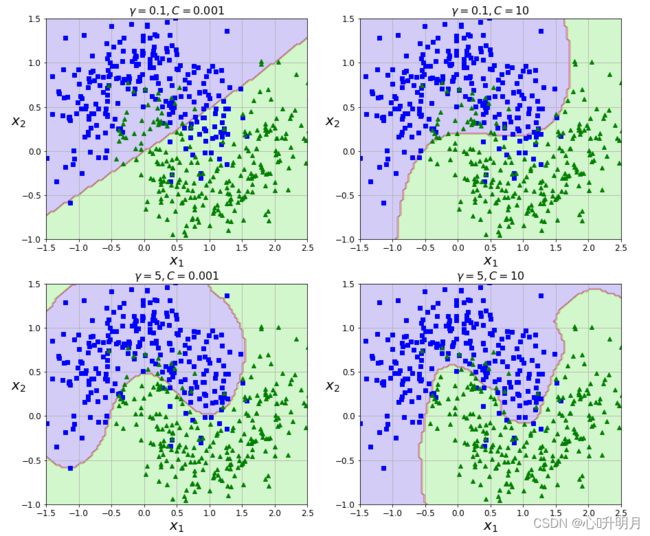
- 增加 γ \gamma γ使高斯曲线变窄,因此每个实例的影响范围都较小:决策边界最终变得更不规则,在个别实例周围摆动。
- 减少 γ \gamma γ使高斯曲线变宽,因此实例具有更大的影响范围,并且决策边界更加平滑。
下图为不同 γ \gamma γ和C值下的SVM分类效果图:
四、参考文献
[1] 唐宇迪. 跟着迪哥学Python数据分析与机器学习实战[M]. 北京: 人民邮电出版社, 2019: 260-284.
