交通事故等级预测(附代码)
博主最近做了高速公路交通事故等级预测的项目,使用的数据集为英国高速公路2019年事故数据集。本来博主是用它来写论文的,但最近论文方向发生改变,因此将项目分享出来,给大家参考,如果有人做的是事故发生预测,也可以参考一下,具体方法不会差,只是数据标签变一下。由于水平有限,不足之处请见谅。
一、数据收集与处理
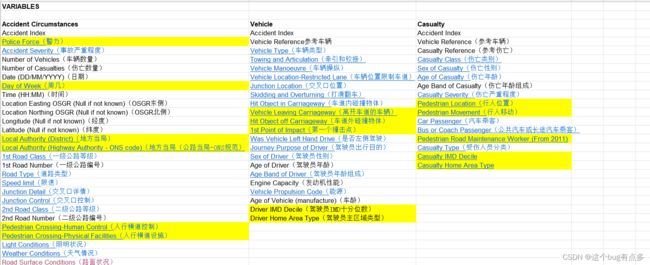
博主找过很多数据,最终采用的是英国高速公路2019年事故数据,在很多论文里也看到有人使用美国高速公路数据,这里推荐大家在csdn上搜一搜,能够搜到,也推荐大家一个公众号“交通邦”,一个东南学长创的,数据比较全,不过英国数据集是2018年的,如果有人需要2019年数据可以和博主联系,但是由于博主收集辛苦,可能需要点费用,后面也会将数据压缩包放到csdn里,关注博主后可以找到发布的下载链接,数据内容具体如图:
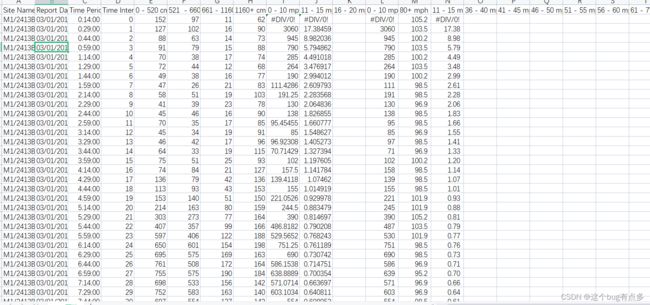
上图可以看出,数据集里面的内容很全,有事故等级、天气、路面条件、灯光等等。对每个数据还会有专门的标注,大家下载之后就能看出。同时,做事故等级预测需要用到交通流数据,我这里也是根据位置在英国的观测点地图上一个个手工定位,花了好几天时间,也会保存到压缩包里发送给有需要的同学,具体也可看图:
上图是一处事故发生点的上游数据,做这方面论文研究的都知道,事故预测是需要用到事故上下游数据的,工作量很大。这已经完成了初步论文处理,紧接着就是对数据进行繁琐的清楚异常值、筛选变量等等操作,统称为数据清洗。这里的程序虽然简单,但是内容繁杂,就不将代码粘贴上来了。
二、参数排序
我们将数据清洗完成之后,就需要面临一个问题,选择哪些参数来建立预测模型。从之前的数据图中也可以看到,可选数据太多,这不是一个好现象,会造成算法的崩溃。因此,我在这里选择用随机森林对各数据的重要度进行排序,代码如下所示:
import numpy as np
import pandas as pd

testset=pd.read_csv("C:\\Users\\15217\\Desktop\\病例组.csv")
#print(testset.head(5))#可以试运行,查看运行结果

"""进行数据集导入"""
dataset=testset
#将不需要进行排序的路面条件提取出来
dataset.target=testset['Road_Surface_Conditions']
dataset.target.head(287)
#将不需要进行排序的列删除
del_key = ['Location_Easting_OSGR','Location_Northing_OSGR','Longitude','Latitude','Accident_Severity','Number_of_Vehicles',
           'Number_of_Casualties','Date','Time','1st_Road_Class','1st_Road_Number','Speed_limit','2nd_Road_Class','2nd_Road_Number',
           'Urban_or_Rural_Area','Vehicle_Reference','Casualty_Reference','Casualty_Class','Casualty_Severity','Car_Passenger',
           'Bus_or_Coach_Passenger','Casualty_Type','上游线圈平均交通量','上游线圈平均速度','上游线圈平均时间占有率',
           '下游线圈平均交通量(辆/30s)','下游线圈平均速度(km/h)','下游线圈平均时间占有率','Location_Northing_OSGR.1']
for key in del_key:
    testset.drop(columns=[key],inplace=True)

#剩余需要排序的特征
dataset.feature_names=testset.columns
dataset.data=testset[['Road_Type', 'Junction_Detail', 'Junction_Control', 'Light_Conditions',
       'Weather_Conditions', 'Road_Surface_Conditions',
       'Special_Conditions_at_Site', 'Sex_of_Casualty', 'Age_of_Casualty',
       'Age_Band_of_Casualty', 'Vehicle_Reference.1', 'Vehicle_Type',
       'Towing_and_Articulation', 'Vehicle_Manoeuvre',
       'Vehicle_Location-Restricted_Lane', 'Junction_Location',
       'Skidding_and_Overturning', 'Was_Vehicle_Left_Hand_Drive?',
       'Journey_Purpose_of_Driver', 'Sex_of_Driver', 'Age_of_Driver',
       'Age_Band_of_Driver', 'Engine_Capacity_(CC)', 'Age_of_Vehicle',
       'Unnamed: 47', '上下游交通量差的绝对值', '上下游平均速度差的绝对值', '上下游平均时间占有率差的绝对值']]

# 用0来代替缺失值
dataset.data = dataset.data.replace(np.nan, 0)
#print(np.isnan(dataset.data).any())

"""处理初始的数据集得到的data、target和feature_names"""
print(dataset.data.shape)
X=dataset.data
print(X.shape)
Y=dataset.target
names=dataset.feature_names
#利用sklearn这个包中的随机森林对特征进行排序
from sklearn.ensemble import RandomForestClassifier
rf=RandomForestClassifier()
rf.fit(X,Y)
print("Features sorted by their score:")
print(sorted(zip(map(lambda x:round(x,4),rf.feature_importances_),names)))

"""绘制比重图"""
per_data = sorted(zip(map(lambda x:round(x,4),rf.feature_importances_),names))
#print(per_data[0][0],per_data[27][0])#总共28个特征值
# -*- coding: utf-8 -*-
import matplotlib.pyplot as plt
name_list = []#特征值名称
per_list = []#可用来存放百分比
for i in range(1,28):
    name_list.append(per_data[i][1])#从1开始,是为了去掉无用的Unnamed,下同
for j in range(1,28):
    per_list.append(per_data[j][0])
plt.rcParams['font.sans-serif'] = ['SimHei'] #显示中文标签
plt.rcParams['axes.unicode_minus'] = False
plt.yticks(fontsize=5)
plt.barh(range(len(per_list)), per_list,tick_label = name_list)#名字太长,放不进去
plt.show()
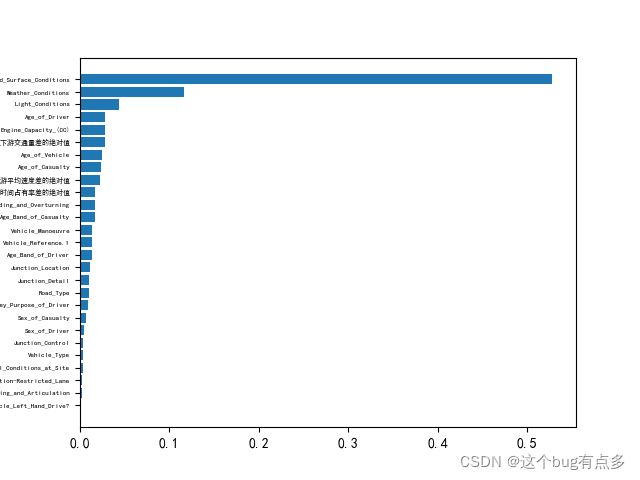
代码运行后,会产生一个重要度排序图:
这里需要选择事故发生前可获得的影响因素为:路面条件、天气状况、光照条件、上下游交通量差的绝对值、上下游平均速度差的绝对值、上下游时间占有率差的绝对值。
三、建立模型
参数选择完成之后,就需要建立相应的预测模型,由于事故等级一般分为轻度、严重、致命三种类型,选择机器学习中的SVM建立模型。同时,在建立模型之后,选择网格搜索优化参数来对g和C进行调参,得到预测精度最高的模型。相关代码如下:
from sklearn import svm
from sklearn.svm import SVC
import sklearn
import matplotlib.pyplot as plt
import matplotlib
import numpy as np
from numpy import loadtxt
import pandas as pd
import csv
from sklearn import preprocessing
from sklearn.model_selection import  cross_val_score
from mpl_toolkits.mplot3d import Axes3D
from sklearn.model_selection import GridSearchCV
"""读取样本"""
#define converts(字典)
def Iris_label(s):
    it={b'\\ufeff2':2 }
    return it[s]

#data=np.array(rows)#rows是数据类型是‘list',转化为数组类型好处理
path = 'C:\\Users\\15217\\Desktop\\SVM样本.csv'
data=np.loadtxt(path, dtype=float, delimiter=',',encoding='utf-8-sig')
#print("out0=",type(data),data.shape)
#print("out1=",data)

"""划分数据与标签"""
y,x=np.split(data,indices_or_sections=(1,),axis=1) #x为数据,y为标签,axis是分割的方向,1表示横向,0表示纵向,默认为0
x=x[:,0:6]#为便于后边画图显示(二维显示),只选取前两维度。若不用画图,可选取前六列x[:,0:6]

"""使用SMOTE算法"""
y_1 = y[:,0]
from collections import Counter
print(Counter(y_1))
# 使用imlbearn库中上采样方法中的SMOTE接口
from imblearn.over_sampling import SMOTE
# 定义SMOTE模型,random_state相当于随机数种子的作用
smo = SMOTE(random_state=50)
X = x.astype('float64')
X_smo, y_smo = smo.fit_resample(X, y_1)
print(Counter(y_smo))
print(X_smo)
print(type(X_smo))

train_data,test_data,train_label,test_label =sklearn.model_selection.train_test_split(X_smo,
                                                                                      y_smo,
                                                                                      random_state=1,
                                                                       #作用是通过随机数来随机取得一定量得样本作为训练样本和测试样本
                                                                                      train_size=0.7,
                                                                                      test_size=0.3)

"""网格搜索优化参数"""
results = []
for i in (-5, -4, -3, -2, -1, 0, 1, 2, 3, 4, 5):
    C = 2 ** i
    for j in (-5, -4, -3, -2, -1, 0, 1, 2, 3, 4, 5):
        G = 2 ** j
        """训练svm分类器"""
        classifier=svm.SVC(C=C,kernel='rbf',gamma=G,decision_function_shape='ovr') # ovr:一对多策略
        classifier.fit(train_data,train_label.ravel()) #ravel函数在降维时默认是行序优先

        """计算分类准确率"""
        #print("训练集:",classifier.score(train_data,train_label))
        #print("测试集:",classifier.score(test_data,test_label))
        results.append(classifier.score(test_data,test_label))
        if classifier.score(test_data,test_label) == 0.8308457711442786:
            tra_label = classifier.predict(train_data)  # 训练集的预测标签
            tes_label = classifier.predict(test_data)  # 测试集的预测标签
            print("训练集:",classifier.score(train_data,train_label))
            print("测试集:", classifier.score(test_data, test_label))
            print("C=",C)
            print("G=", G)
results_new = list(set(results))
results1=sorted(results_new,reverse=True)
for i in results1:
    print(i)
模型建立完成之后,需要一个混淆矩阵来显示预测结果,而不是单纯写个精度。
"""输出混淆矩阵"""
from sklearn.metrics import confusion_matrix
def my_confusion_matrix(y_true, y_pred):
    labels = list(set(y_true))
    conf_mat = confusion_matrix(list(y_true), list(y_pred), labels = labels)
    print ("confusion_matrix(left labels: y_true, up labels: y_pred):")
    print ("labels"," ",end='')
    for i in range(len(labels)):
        print (labels[i]," ",end='')
    print('\n')
    for i in range(len(conf_mat)):
        print (i+1," ",end='')
        for j in range(len(conf_mat[i])):
            print (conf_mat[i][j]," ",end='')
        print('\n')

y_test = list(map(float,test_label))
y_pred = list(map(float,classifier.predict(test_data)))
print(y_test)
print(y_pred)
my_confusion_matrix(y_test, y_pred) # 输出混淆矩阵
输出的结果如下:
 可以看到预测精度还是不理想,初步推测误差来源于数据样本中不同事故等级与其它数据关联不明显,程序难以识别,这也是我下一个优化方向,但因为换研究方向了,也就没法继续学术探讨了,如果有人感兴趣,可以继续做。
看在博主这么真诚分享的份上,给个点赞关注吧!
目录
一、数据收集与处理
二、参数排序
三、建立模型


