Mask RCNN批量输出分割图片( 附 test.py)
Mask RCNN复现及批量输出分割图片
- 1 Mask RCNN复现
- 2 Mask RCNN批量输出分割图片
-
- 2.1 路径修改
-
- 2.1.1 COCO_MODEL_PATH
- 2.1.2 IMAGE_DIR
- 2.1.3 plt.savefig
- 2.2 运行结果
- 2.3 test.py
- 2.4 备注
1 Mask RCNN复现
- 参考文章
2 Mask RCNN批量输出分割图片
2.1 路径修改
2.1.1 COCO_MODEL_PATH
- 此路径为 mask_rcnn_coco.h5 的存放位置(Mask RCNN的根目录下)
COCO_MODEL_PATH = os.path.join(ROOT_DIR, "mask_rcnn_coco.h5")
2.1.2 IMAGE_DIR
- 此路径为 测试图片 文件夹所在的位置(Mask RCNN的根目录下)
IMAGE_DIR = os.path.join(ROOT_DIR, "img_test")
2.1.3 plt.savefig
- 此路径为 分割图片 文件夹所在的位置(Mask RCNN的根目录下)
- 其中count [11:16] 是图片结果的命名 为测试图片名字的12~16位,可自己修改
plt.savefig("../test_results/%3s.png" % (str(count[11:16])))
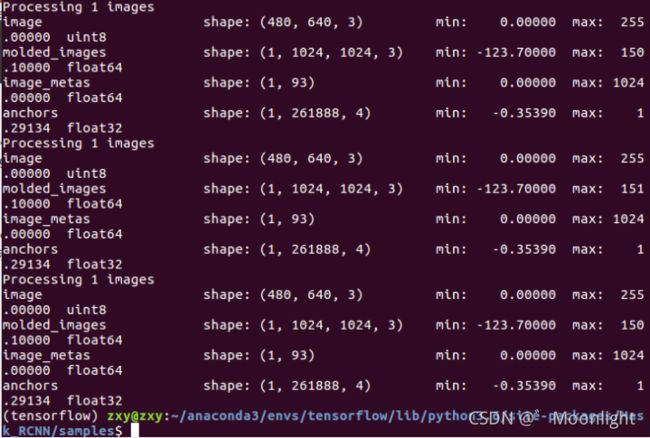
2.2 运行结果

2.3 test.py
- 直接运行即可
#!/usr/bin/env python
# coding: utf-8
# # Mask R-CNN Demo
#
# A quick intro to using the pre-trained model to detect and segment objects.
# In[1]:
import os
import sys
import random
import math
import numpy as np
import skimage.io
import matplotlib
import matplotlib.pyplot as plt
import itertools
import colorsys
import numpy as np
from skimage.measure import find_contours
import matplotlib.pyplot as plt
from matplotlib import patches, lines
from matplotlib.patches import Polygon
import IPython.display
# Root directory of the project
ROOT_DIR = os.path.abspath("../")
# Import Mask RCNN
sys.path.append(ROOT_DIR) # To find local version of the library
from mrcnn import utils
import mrcnn.model as modellib
#from mrcnn import visualize
# Import COCO config
sys.path.append(os.path.join(ROOT_DIR, "samples/coco/")) # To find local version
import coco
#get_ipython().run_line_magic('matplotlib', 'inline')
# Directory to save logs and trained model
MODEL_DIR = os.path.join(ROOT_DIR, "logs")
# Local path to trained weights file
COCO_MODEL_PATH = os.path.join(ROOT_DIR, "mask_rcnn_coco.h5")
# Download COCO trained weights from Releases if needed
if not os.path.exists(COCO_MODEL_PATH):
utils.download_trained_weights(COCO_MODEL_PATH)
# Directory of images to run detection on
IMAGE_DIR = os.path.join(ROOT_DIR, "img_test")
# ## Configurations
#
# We'll be using a model trained on the MS-COCO dataset. The configurations of this model are in the ```CocoConfig```class in ```coco.py```.
#
# For inferencing, modify the configurations a bit to fit the task. To do so, sub-class the ```CocoConfig```class and override the attributes you need to change.
# In[2]:
class InferenceConfig(coco.CocoConfig):
# Set batch size to 1 since we'll be running inference on
# one image at a time. Batch size = GPU_COUNT * IMAGES_PER_GPU
GPU_COUNT = 1
IMAGES_PER_GPU = 1
config = InferenceConfig()
config.display()
# ## Create Model and Load Trained Weights
# In[3]:
# Create model object in inference mode.
model = modellib.MaskRCNN(mode="inference", model_dir=MODEL_DIR, config=config)
# Load weights trained on MS-COCO
model.load_weights(COCO_MODEL_PATH, by_name=True)
# ## Class Names
#
# The model classifies objects and returns class IDs, which are integer value that identify each class. Some datasets assign integer values to their classes and some don't. For example, in the MS-COCO dataset, the 'person' class is 1 and 'teddy bear' is 88. The IDs are often sequential, but not always. The COCO dataset, for example, has classes associated with class IDs 70 and 72, but not 71.
#
# To improve consistency, and to support training on data from multiple sources at the same time, our ```Dataset```class assigns it's own sequential integer IDs to each class. For example, if you load the COCO dataset using our ```Dataset```class, the 'person' class would get class ID = 1 (just like COCO) and the 'teddy bear' class is 78 (different from COCO). Keep that in mind when mapping class IDs to class names.
#
# To get the list of class names, you'd load the dataset and then use the ```class_names```property like this.
# ```
# # Load COCO dataset
# dataset = coco.CocoDataset()
# dataset.load_coco(COCO_DIR, "train")
# dataset.prepare()
#
# # Print class names
# print(dataset.class_names)
# ```
#
# We don't want to require you to download the COCO dataset just to run this demo, so we're including the list of class names below. The index of the class name in the list represent its ID (first class is 0, second is 1, third is 2, ...etc.)
# In[4]:
# # visualize.py
#************************************************************
#************************************************************
def display_images(images, titles=None, cols=4, cmap=None, norm=None,
interpolation=None):
"""Display the given set of images, optionally with titles.
images: list or array of image tensors in HWC format.
titles: optional. A list of titles to display with each image.
cols: number of images per row
cmap: Optional. Color map to use. For example, "Blues".
norm: Optional. A Normalize instance to map values to colors.
interpolation: Optional. Image interpolation to use for display.
"""
titles = titles if titles is not None else [""] * len(images)
rows = len(images) // cols + 1
plt.figure(figsize=(14, 14 * rows // cols))
i = 1
for image, title in zip(images, titles):
plt.subplot(rows, cols, i)
plt.title(title, fontsize=9)
plt.axis('off')
plt.imshow(image.astype(np.uint8), cmap=cmap,
norm=norm, interpolation=interpolation)
i += 1
plt.show()
def random_colors(N, bright=True):
"""
Generate random colors.
To get visually distinct colors, generate them in HSV space then
convert to RGB.
"""
brightness = 1.0 if bright else 0.7
hsv = [(i / N, 1, brightness) for i in range(N)]
colors = list(map(lambda c: colorsys.hsv_to_rgb(*c), hsv))
random.shuffle(colors)
return colors
def apply_mask(image, mask, color, alpha=0.5):
"""Apply the given mask to the image.
"""
for c in range(3):
image[:, :, c] = np.where(mask == 1,
image[:, :, c] *
(1 - alpha) + alpha * color[c] * 255,
image[:, :, c])
return image
def display_instances(count,image, boxes, masks, class_ids, class_names,
scores=None, title="",
figsize=(16, 16), ax=None,
show_mask=True, show_bbox=True,
colors=None, captions=None):
"""
boxes: [num_instance, (y1, x1, y2, x2, class_id)] in image coordinates.
masks: [height, width, num_instances]
class_ids: [num_instances]
class_names: list of class names of the dataset
scores: (optional) confidence scores for each box
title: (optional) Figure title
show_mask, show_bbox: To show masks and bounding boxes or not
figsize: (optional) the size of the image
colors: (optional) An array or colors to use with each object
captions: (optional) A list of strings to use as captions for each object
"""
# Number of instances
N = boxes.shape[0]
if not N:
print("\n*** No instances to display *** \n")
else:
assert boxes.shape[0] == masks.shape[-1] == class_ids.shape[0]
# If no axis is passed, create one and automatically call show()
auto_show = False
if not ax:
_, ax = plt.subplots(1, figsize=figsize)
auto_show = True
# Generate random colors
colors = colors or random_colors(N)
# Show area outside image boundaries.
height, width = image.shape[:2]
ax.set_ylim(height + 10, -10)
ax.set_xlim(-10, width + 10)
ax.axis('off')
ax.set_title(title)
masked_image = image.astype(np.uint32).copy()
for i in range(N):
color = colors[i]
# Bounding box
if not np.any(boxes[i]):
# Skip this instance. Has no bbox. Likely lost in image cropping.
continue
y1, x1, y2, x2 = boxes[i]
if show_bbox:
p = patches.Rectangle((x1, y1), x2 - x1, y2 - y1, linewidth=2,
alpha=0.7, linestyle="dashed",
edgecolor=color, facecolor='none')
ax.add_patch(p)
# Label
if not captions:
class_id = class_ids[i]
score = scores[i] if scores is not None else None
label = class_names[class_id]
caption = "{} {:.3f}".format(label, score) if score else label
else:
caption = captions[i]
ax.text(x1, y1 + 8, caption,
color='w', size=11, backgroundcolor="none")
# Mask
mask = masks[:, :, i]
if show_mask:
masked_image = apply_mask(masked_image, mask, color)
# Mask Polygon
# Pad to ensure proper polygons for masks that touch image edges.
padded_mask = np.zeros(
(mask.shape[0] + 2, mask.shape[1] + 2), dtype=np.uint8)
padded_mask[1:-1, 1:-1] = mask
contours = find_contours(padded_mask, 0.5)
for verts in contours:
# Subtract the padding and flip (y, x) to (x, y)
verts = np.fliplr(verts) - 1
p = Polygon(verts, facecolor="none", edgecolor=color)
ax.add_patch(p)
ax.imshow(masked_image.astype(np.uint8))
if auto_show:
#plt.savefig("/home/zxy/123456.jpg")
plt.savefig("../test_results/%3s.png" % (str(count[11:16])))
#plt.show()
def display_differences(image,
gt_box, gt_class_id, gt_mask,
pred_box, pred_class_id, pred_score, pred_mask,
class_names, title="", ax=None,
show_mask=True, show_box=True,
iou_threshold=0.5, score_threshold=0.5):
"""Display ground truth and prediction instances on the same image."""
# Match predictions to ground truth
gt_match, pred_match, overlaps = utils.compute_matches(
gt_box, gt_class_id, gt_mask,
pred_box, pred_class_id, pred_score, pred_mask,
iou_threshold=iou_threshold, score_threshold=score_threshold)
# Ground truth = green. Predictions = red
colors = [(0, 1, 0, .8)] * len(gt_match)\
+ [(1, 0, 0, 1)] * len(pred_match)
# Concatenate GT and predictions
class_ids = np.concatenate([gt_class_id, pred_class_id])
scores = np.concatenate([np.zeros([len(gt_match)]), pred_score])
boxes = np.concatenate([gt_box, pred_box])
masks = np.concatenate([gt_mask, pred_mask], axis=-1)
# Captions per instance show score/IoU
captions = ["" for m in gt_match] + ["{:.2f} / {:.2f}".format(
pred_score[i],
(overlaps[i, int(pred_match[i])]
if pred_match[i] > -1 else overlaps[i].max()))
for i in range(len(pred_match))]
# Set title if not provided
title = title or "Ground Truth and Detections\n GT=green, pred=red, captions: score/IoU"
# Display
display_instances(
image,
boxes, masks, class_ids,
class_names, scores, ax=ax,
show_bbox=show_box, show_mask=show_mask,
colors=colors, captions=captions,
title=title)
def draw_rois(image, rois, refined_rois, mask, class_ids, class_names, limit=10):
"""
anchors: [n, (y1, x1, y2, x2)] list of anchors in image coordinates.
proposals: [n, 4] the same anchors but refined to fit objects better.
"""
masked_image = image.copy()
# Pick random anchors in case there are too many.
ids = np.arange(rois.shape[0], dtype=np.int32)
ids = np.random.choice(
ids, limit, replace=False) if ids.shape[0] > limit else ids
fig, ax = plt.subplots(1, figsize=(12, 12))
if rois.shape[0] > limit:
plt.title("Showing {} random ROIs out of {}".format(
len(ids), rois.shape[0]))
else:
plt.title("{} ROIs".format(len(ids)))
# Show area outside image boundaries.
ax.set_ylim(image.shape[0] + 20, -20)
ax.set_xlim(-50, image.shape[1] + 20)
ax.axis('off')
for i, id in enumerate(ids):
color = np.random.rand(3)
class_id = class_ids[id]
# ROI
y1, x1, y2, x2 = rois[id]
p = patches.Rectangle((x1, y1), x2 - x1, y2 - y1, linewidth=2,
edgecolor=color if class_id else "gray",
facecolor='none', linestyle="dashed")
ax.add_patch(p)
# Refined ROI
if class_id:
ry1, rx1, ry2, rx2 = refined_rois[id]
p = patches.Rectangle((rx1, ry1), rx2 - rx1, ry2 - ry1, linewidth=2,
edgecolor=color, facecolor='none')
ax.add_patch(p)
# Connect the top-left corners of the anchor and proposal for easy visualization
ax.add_line(lines.Line2D([x1, rx1], [y1, ry1], color=color))
# Label
label = class_names[class_id]
ax.text(rx1, ry1 + 8, "{}".format(label),
color='w', size=11, backgroundcolor="none")
# Mask
m = utils.unmold_mask(mask[id], rois[id]
[:4].astype(np.int32), image.shape)
masked_image = apply_mask(masked_image, m, color)
ax.imshow(masked_image)
# Print stats
print("Positive ROIs: ", class_ids[class_ids > 0].shape[0])
print("Negative ROIs: ", class_ids[class_ids == 0].shape[0])
print("Positive Ratio: {:.2f}".format(
class_ids[class_ids > 0].shape[0] / class_ids.shape[0]))
# TODO: Replace with matplotlib equivalent?
def draw_box(image, box, color):
"""Draw 3-pixel width bounding boxes on the given image array.
color: list of 3 int values for RGB.
"""
y1, x1, y2, x2 = box
image[y1:y1 + 2, x1:x2] = color
image[y2:y2 + 2, x1:x2] = color
image[y1:y2, x1:x1 + 2] = color
image[y1:y2, x2:x2 + 2] = color
return image
def display_top_masks(image, mask, class_ids, class_names, limit=4):
"""Display the given image and the top few class masks."""
to_display = []
titles = []
to_display.append(image)
titles.append("H x W={}x{}".format(image.shape[0], image.shape[1]))
# Pick top prominent classes in this image
unique_class_ids = np.unique(class_ids)
mask_area = [np.sum(mask[:, :, np.where(class_ids == i)[0]])
for i in unique_class_ids]
top_ids = [v[0] for v in sorted(zip(unique_class_ids, mask_area),
key=lambda r: r[1], reverse=True) if v[1] > 0]
# Generate images and titles
for i in range(limit):
class_id = top_ids[i] if i < len(top_ids) else -1
# Pull masks of instances belonging to the same class.
m = mask[:, :, np.where(class_ids == class_id)[0]]
m = np.sum(m * np.arange(1, m.shape[-1] + 1), -1)
to_display.append(m)
titles.append(class_names[class_id] if class_id != -1 else "-")
display_images(to_display, titles=titles, cols=limit + 1, cmap="Blues_r")
def plot_precision_recall(AP, precisions, recalls):
"""Draw the precision-recall curve.
AP: Average precision at IoU >= 0.5
precisions: list of precision values
recalls: list of recall values
"""
# Plot the Precision-Recall curve
_, ax = plt.subplots(1)
ax.set_title("Precision-Recall Curve. AP@50 = {:.3f}".format(AP))
ax.set_ylim(0, 1.1)
ax.set_xlim(0, 1.1)
_ = ax.plot(recalls, precisions)
def plot_overlaps(gt_class_ids, pred_class_ids, pred_scores,
overlaps, class_names, threshold=0.5):
"""Draw a grid showing how ground truth objects are classified.
gt_class_ids: [N] int. Ground truth class IDs
pred_class_id: [N] int. Predicted class IDs
pred_scores: [N] float. The probability scores of predicted classes
overlaps: [pred_boxes, gt_boxes] IoU overlaps of predictions and GT boxes.
class_names: list of all class names in the dataset
threshold: Float. The prediction probability required to predict a class
"""
gt_class_ids = gt_class_ids[gt_class_ids != 0]
pred_class_ids = pred_class_ids[pred_class_ids != 0]
plt.figure(figsize=(12, 10))
plt.imshow(overlaps, interpolation='nearest', cmap=plt.cm.Blues)
plt.yticks(np.arange(len(pred_class_ids)),
["{} ({:.2f})".format(class_names[int(id)], pred_scores[i])
for i, id in enumerate(pred_class_ids)])
plt.xticks(np.arange(len(gt_class_ids)),
[class_names[int(id)] for id in gt_class_ids], rotation=90)
thresh = overlaps.max() / 2.
for i, j in itertools.product(range(overlaps.shape[0]),
range(overlaps.shape[1])):
text = ""
if overlaps[i, j] > threshold:
text = "match" if gt_class_ids[j] == pred_class_ids[i] else "wrong"
color = ("white" if overlaps[i, j] > thresh
else "black" if overlaps[i, j] > 0
else "grey")
plt.text(j, i, "{:.3f}\n{}".format(overlaps[i, j], text),
horizontalalignment="center", verticalalignment="center",
fontsize=9, color=color)
plt.tight_layout()
plt.xlabel("Ground Truth")
plt.ylabel("Predictions")
def draw_boxes(image, boxes=None, refined_boxes=None,
masks=None, captions=None, visibilities=None,
title="", ax=None):
"""Draw bounding boxes and segmentation masks with different
customizations.
boxes: [N, (y1, x1, y2, x2, class_id)] in image coordinates.
refined_boxes: Like boxes, but draw with solid lines to show
that they're the result of refining 'boxes'.
masks: [N, height, width]
captions: List of N titles to display on each box
visibilities: (optional) List of values of 0, 1, or 2. Determine how
prominent each bounding box should be.
title: An optional title to show over the image
ax: (optional) Matplotlib axis to draw on.
"""
# Number of boxes
assert boxes is not None or refined_boxes is not None
N = boxes.shape[0] if boxes is not None else refined_boxes.shape[0]
# Matplotlib Axis
if not ax:
_, ax = plt.subplots(1, figsize=(12, 12))
# Generate random colors
colors = random_colors(N)
# Show area outside image boundaries.
margin = image.shape[0] // 10
ax.set_ylim(image.shape[0] + margin, -margin)
ax.set_xlim(-margin, image.shape[1] + margin)
ax.axis('off')
ax.set_title(title)
masked_image = image.astype(np.uint32).copy()
for i in range(N):
# Box visibility
visibility = visibilities[i] if visibilities is not None else 1
if visibility == 0:
color = "gray"
style = "dotted"
alpha = 0.5
elif visibility == 1:
color = colors[i]
style = "dotted"
alpha = 1
elif visibility == 2:
color = colors[i]
style = "solid"
alpha = 1
# Boxes
if boxes is not None:
if not np.any(boxes[i]):
# Skip this instance. Has no bbox. Likely lost in cropping.
continue
y1, x1, y2, x2 = boxes[i]
p = patches.Rectangle((x1, y1), x2 - x1, y2 - y1, linewidth=2,
alpha=alpha, linestyle=style,
edgecolor=color, facecolor='none')
ax.add_patch(p)
# Refined boxes
if refined_boxes is not None and visibility > 0:
ry1, rx1, ry2, rx2 = refined_boxes[i].astype(np.int32)
p = patches.Rectangle((rx1, ry1), rx2 - rx1, ry2 - ry1, linewidth=2,
edgecolor=color, facecolor='none')
ax.add_patch(p)
# Connect the top-left corners of the anchor and proposal
if boxes is not None:
ax.add_line(lines.Line2D([x1, rx1], [y1, ry1], color=color))
# Captions
if captions is not None:
caption = captions[i]
# If there are refined boxes, display captions on them
if refined_boxes is not None:
y1, x1, y2, x2 = ry1, rx1, ry2, rx2
ax.text(x1, y1, caption, size=11, verticalalignment='top',
color='w', backgroundcolor="none",
bbox={'facecolor': color, 'alpha': 0.5,
'pad': 2, 'edgecolor': 'none'})
# Masks
if masks is not None:
mask = masks[:, :, i]
masked_image = apply_mask(masked_image, mask, color)
# Mask Polygon
# Pad to ensure proper polygons for masks that touch image edges.
padded_mask = np.zeros(
(mask.shape[0] + 2, mask.shape[1] + 2), dtype=np.uint8)
padded_mask[1:-1, 1:-1] = mask
contours = find_contours(padded_mask, 0.5)
for verts in contours:
# Subtract the padding and flip (y, x) to (x, y)
verts = np.fliplr(verts) - 1
p = Polygon(verts, facecolor="none", edgecolor=color)
ax.add_patch(p)
ax.imshow(masked_image.astype(np.uint8))
def display_table(table):
"""Display values in a table format.
table: an iterable of rows, and each row is an iterable of values.
"""
html = ""
for row in table:
row_html = ""
for col in row:
row_html += "{:40} ".format(str(col))
html += "" + row_html + " "
html = "" + html + "
"
IPython.display.display(IPython.display.HTML(html))
def display_weight_stats(model):
"""Scans all the weights in the model and returns a list of tuples
that contain stats about each weight.
"""
layers = model.get_trainable_layers()
table = [["WEIGHT NAME", "SHAPE", "MIN", "MAX", "STD"]]
for l in layers:
weight_values = l.get_weights() # list of Numpy arrays
weight_tensors = l.weights # list of TF tensors
for i, w in enumerate(weight_values):
weight_name = weight_tensors[i].name
# Detect problematic layers. Exclude biases of conv layers.
alert = ""
if w.min() == w.max() and not (l.__class__.__name__ == "Conv2D" and i == 1):
alert += "*** dead?"
if np.abs(w.min()) > 1000 or np.abs(w.max()) > 1000:
alert += "*** Overflow?"
# Add row
table.append([
weight_name + alert,
str(w.shape),
"{:+9.4f}".format(w.min()),
"{:+10.4f}".format(w.max()),
"{:+9.4f}".format(w.std()),
])
display_table(table)
#************************************************************
#************************************************************
# COCO Class names
# Index of the class in the list is its ID. For example, to get ID of
# the teddy bear class, use: class_names.index('teddy bear')
class_names = ['BG', 'person', 'bicycle', 'car', 'motorcycle', 'airplane',
'bus', 'train', 'truck', 'boat', 'traffic light',
'fire hydrant', 'stop sign', 'parking meter', 'bench', 'bird',
'cat', 'dog', 'horse', 'sheep', 'cow', 'elephant', 'bear',
'zebra', 'giraffe', 'backpack', 'umbrella', 'handbag', 'tie',
'suitcase', 'frisbee', 'skis', 'snowboard', 'sports ball',
'kite', 'baseball bat', 'baseball glove', 'skateboard',
'surfboard', 'tennis racket', 'bottle', 'wine glass', 'cup',
'fork', 'knife', 'spoon', 'bowl', 'banana', 'apple',
'sandwich', 'orange', 'broccoli', 'carrot', 'hot dog', 'pizza',
'donut', 'cake', 'chair', 'couch', 'potted plant', 'bed',
'dining table', 'toilet', 'tv', 'laptop', 'mouse', 'remote',
'keyboard', 'cell phone', 'microwave', 'oven', 'toaster',
'sink', 'refrigerator', 'book', 'clock', 'vase', 'scissors',
'teddy bear', 'hair drier', 'toothbrush']
# ## Run Object Detection
# In[5]:
# Load a random image from the images folder
file_names = next(os.walk(IMAGE_DIR))[2]
image = skimage.io.imread(os.path.join(IMAGE_DIR, random.choice(file_names)))
# Run detection
results = model.detect([image], verbose=1)
# Visualize results
r = results[0]
#visualize.display_instances(image, r['rois'], r['masks'], r['class_ids'],
# class_names, r['scores'])
#display_instances(image, r['rois'], r['masks'], r['class_ids'],
# class_names, r['scores'])
count = os.listdir(IMAGE_DIR)
for i in range(0,len(count)):
path = os.path.join(IMAGE_DIR, count[i])
if os.path.isfile(path):
file_names = next(os.walk(IMAGE_DIR))[2]
image = skimage.io.imread(os.path.join(IMAGE_DIR, count[i]))
# Run detection
results = model.detect([image], verbose=1)
r = results[0]
display_instances(count[i],image, r['rois'], r['masks'], r['class_ids'],
class_names, r['scores'])
# In[ ]:
2.4 备注
- 修改visualize.py
//在函数定义中加入count参数
def display_instances(count,image, boxes, masks, class_ids, class_names,
                      scores=None, title="",
                      figsize=(16, 16), ax=None,
                      show_mask=True, show_bbox=True,
                      colors=None, captions=None):

//加入保存函数plt.savefig
if auto_show:
        plt.savefig("../test_results/%3s.jpg"%(str(count[11:16])))
        plt.show()
- 修改demo.py
count = os.listdir(IMAGE_DIR)
for i in range(0,len(count)):
    path = os.path.join(IMAGE_DIR, count[i])
    if os.path.isfile(path):
        file_names = next(os.walk(IMAGE_DIR))[2]
        image = skimage.io.imread(os.path.join(IMAGE_DIR, count[i]))
        # Run detection
        results = model.detect([image], verbose=1)
        r = results[0]
        display_instances(count[i],image, r['rois'], r['masks'], r['class_ids'],
                            class_names, r['scores'])
参考 https://blog.csdn.net/yql_617540298/article/details/81123147