Python 图形库-小提琴图(含代码)
⏱ 快速入门
Seaborn绝对是快速构建小提琴情节的最佳库。它提供了一个专门的violinplot()功能,大致工作如下:
# library & dataset
import seaborn as sns
df = sns.load_dataset('iris')

# plot
sns.violinplot(x=df["species"], y=df["sepal_length"])
小提琴图允许可视化一个或多个组的数字变量的分布。它与箱形图非常接近,但可以更深入地了解密度。小提琴图特别适用于数据量巨大且无法显示个别观察结果的情况。在seaborn中使用violinplot函数绘制小提琴图
单个变量 One numerical variable only
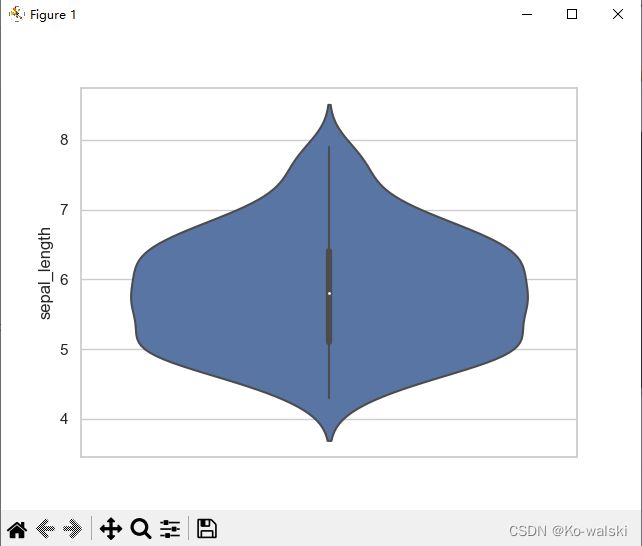
如果只有一个数值变量,则最好制作直方图或密度图。但是你仍然也可以使用 violinplot 函数来描述这个变量的分布,如下:
# Library and database
# 图1
import seaborn as sns
import matplotlib.pyplot as plt

# 设置灰色背景(如果 seaborn 版本为 0.11.0 或更高版本,请使用 sns.set_theme())
sns.set(style="whitegrid")  # 主题:white, dark, whitegrid, darkgrid, ticks
df = sns.load_dataset('iris')  # 从在线资源库加载一个示例数据集

# print(df.head)
# 只做一组的箱线图
sns.violinplot(y=df["sepal_length"])  # df.head: sepal_length  sepal_width  petal_length  petal_width    species
plt.show()
包含多个分组的单个变量 One variable and several groups
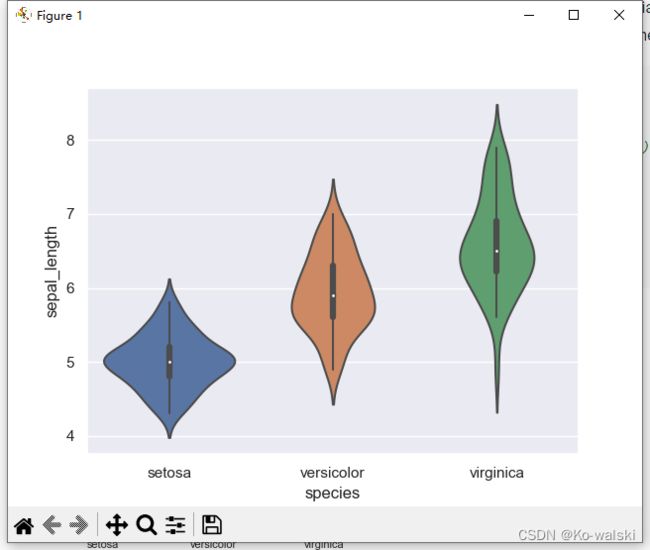
通常,violinplot的用法与boxplot类似:当你有多组的单个变量时。它可以比较组与组的分布。通常使用两列,一列变量的值,另一列是组:
# Library and database
# 图2
import seaborn as sns
import matplotlib.pyplot as plt

# 设置灰色背景(如果 seaborn 版本为 0.11.0 或更高版本,请使用 sns.set_theme())
sns.set(style="darkgrid")  # 主题风格:white, dark, whitegrid, darkgrid, ticks
df = sns.load_dataset('iris')  # 从在线资源库加载一个示例数据集

# plot
sns.violinplot( x=df["species"], y=df["sepal_length"] )
plt.show()
多个变量 Several variables
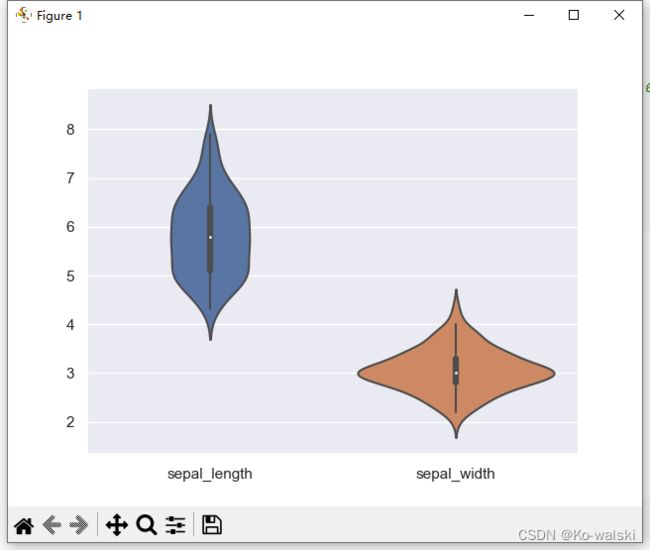
小提琴图也可用于比较多个变量。在 iris 数据集中,我们可以比较前 2 个数值变量:
# Library and database
import seaborn as sns
import matplotlib.pyplot as plt

# 设置灰色背景(如果 seaborn 版本为 0.11.0 或更高版本,请使用 sns.set_theme())
sns.set(style="darkgrid")  # 主题风格:white, dark, whitegrid, darkgrid, ticks
df = sns.load_dataset('iris')  # 从在线资源库加载一个示例数据集

# plot
sns.violinplot(data=df.iloc[:,0:2])
plt.show()


