python柱状图加百分比_【python】封装接口直接利用DataFrame绘制百分比柱状图
手动反爬虫:原博地址
知识梳理不易,请尊重劳动成果,文章仅发布在CSDN网站上,在其他网站看到该博文均属于未经作者授权的恶意爬取信息
1. 背景前言
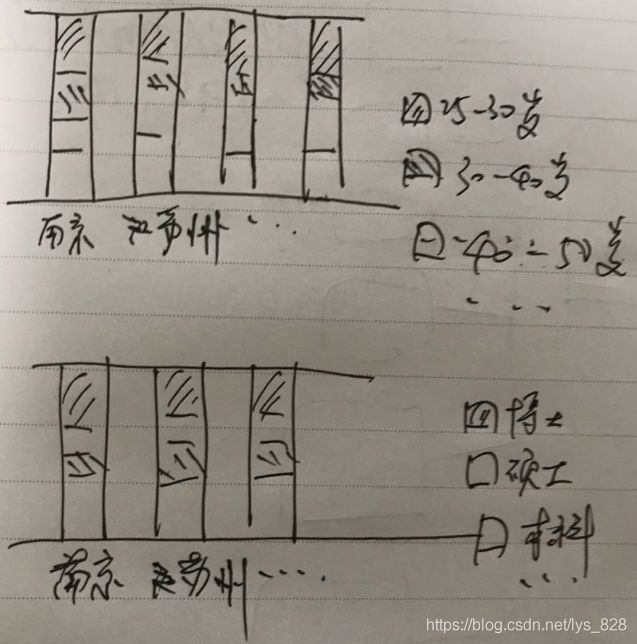
最近打比赛遇到的问题有点多,在绘制了堆叠柱状图之后,队长说不仅要看到具体的数量多少的堆叠图,还要看到具体占比的百分比柱状图,具体的样例可参考灵魂画图,因此也就产生了绘制百分比柱状图的需求
2. 官方网址示例
2.1 matplotlib_percentage_stacked_bar_plot
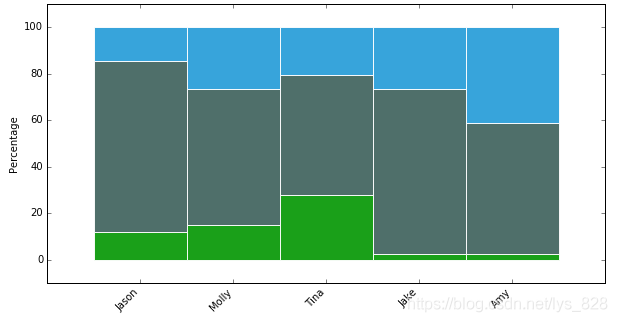
里面的代码是真的长,完全属于一步步进行“堆砖块”然后才形成的百分比堆叠图,最终得出图结果如下:
2.2 percent-stacked-barplot
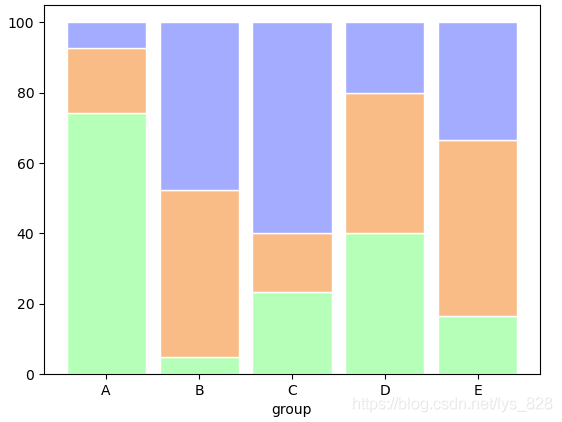
这个网址给出的代码比第一个网址给出的较为简洁,但是本质上都是属于一个个“砖块”的叠加,代码及生成的示例图形如下:
# libraries
import numpy as np
import matplotlib.pyplot as plt
from matplotlib import rc
import pandas as pd
# Data
r = [0,1,2,3,4]
raw_data = {'greenBars': [20, 1.5, 7, 10, 5], 'orangeBars': [5, 15, 5, 10, 15],'blueBars': [2, 15, 18, 5, 10]}
df = pd.DataFrame(raw_data)
# From raw value to percentage
totals = [i+j+k for i,j,k in zip(df['greenBars'], df['orangeBars'], df['blueBars'])]
greenBars = [i / j * 100 for i,j in zip(df['greenBars'], totals)]
orangeBars = [i / j * 100 for i,j in zip(df['orangeBars'], totals)]
blueBars = [i / j * 100 for i,j in zip(df['blueBars'], totals)]
# plot
barWidth = 0.85
names = ('A','B','C','D','E')
# Create green Bars
plt.bar(r, greenBars, color='#b5ffb9', edgecolor='white', width=barWidth)
# Create orange Bars
plt.bar(r, orangeBars, bottom=greenBars, color='#f9bc86', edgecolor='white', width=barWidth)
# Create blue Bars
plt.bar(r, blueBars, bottom=[i+j for i,j in zip(greenBars, orangeBars)], color='#a3acff', edgecolor='white', width=barWidth)
# Custom x axis
plt.xticks(r, names)
plt.xlabel("group")
# Show graphic
plt.show()
→ 输出的结果为:(这个结果相对好一点)
2.3 Discrete distribution as horizontal bar chart
官方给出的示例图是下面这样的,看的第一眼是非常符合自己的要求的,而且还有不同的配色以及主题的标签设置及文本文字标注
接着就看一下给出的源码,如下,代码封装的挺不错的,还有可以直接调用的函数,按照官方示例的代码运行后的确可以实现上方的图形效果(内心狂喜~~ )
import numpy as np
import matplotlib.pyplot as plt
category_names = ['Strongly disagree', 'Disagree',
'Neither agree nor disagree', 'Agree', 'Strongly agree']
results = {
'Question 1': [10, 15, 17, 32, 26],
'Question 2': [26, 22, 29, 10, 13],
'Question 3': [35, 37, 7, 2, 19],
'Question 4': [32, 11, 9, 15, 33],
'Question 5': [21, 29, 5, 5, 40],
'Question 6': [8, 19, 5, 30, 38]
}
def survey(results, category_names):
"""
Parameters
----------
results : dict
A mapping from question labels to a list of answers per category.
It is assumed all lists contain the same number of entries and that
it matches the length of *category_names*.
category_names : list of str
The category labels.
"""
labels = list(results.keys())
data = np.array(list(results.values()))
data_cum = data.cumsum(axis=1)
category_colors = plt.get_cmap('RdYlGn')(
np.linspace(0.15, 0.85, data.shape[1]))
fig, ax = plt.subplots(figsize=(9.2, 5))
ax.invert_yaxis()
ax.xaxis.set_visible(False)
ax.set_xlim(0, np.sum(data, axis=1).max())
for i, (colname, color) in enumerate(zip(category_names, category_colors)):
widths = data[:, i]
starts = data_cum[:, i] - widths
ax.barh(labels, widths, left=starts, height=0.5,
label=colname, color=color)
xcenters = starts + widths / 2
r, g, b, _ = color
text_color = 'white' if r * g * b < 0.5 else 'darkgrey'
for y, (x, c) in enumerate(zip(xcenters, widths)):
ax.text(x, y, str(int(c)), ha='center', va='center',
color=text_color)
ax.legend(ncol=len(category_names), bbox_to_anchor=(0, 1),
loc='lower left', fontsize='small')
return fig, ax
survey(results, category_names)
plt.show()
这个官方给出的代码,看似可以解决问题,但是直接调用之后发现,并不是百分比柱状图的结果,比如这里将数据稍作修改,更改数据如下,然后再运行代码
results = {
'Question 1': [10, 15, 17, 32, 26],
'Question 2': [26, 22, 29, 10, 13],
'Question 3': [35, 37, 7, 2, 19],
'Question 4': [32, 11, 9, 15, 33],
'Question 5': [21, 29, 5, 5, 40],
'Question 6': [8, 190, 5, 30, 38] #在19后面加个0
}
→ 输出的结果为:(实际上这个图本身就不是百分比堆叠柱状图,根据官方的名称是离散分布的水平柱形图)
然后百度搜索相关的python绘制的百分比堆叠柱状图基本上都是进行一个个“垒砌”的,看到百度搜索返回的第一个结果,竟然把这个官方的示例声称为自己封装的函数,标题还是绘制百分比柱状图,误导读者(本人也是被忽悠了,直到看到官网示例和实际调试)
3. 问题解决
既然没有现成的可以直接copy的代码,而且也没有像绘制堆叠图时候直接就拥有stacked的参数,所以就必须自己手动整理了。前面的第三个示例代码的框架可以直接拿过来用,就不用再进行编写了,只需要修改部分内容即可
3.1 全部代码
仿照之前的代码形式,进行代码改写,只需要传入DataFrame数据即可,如下
def percentage_bar(df):
labels = df.index.tolist() #提取分类显示标签
results = df.to_dict(orient = 'list') #将数值结果转化为字典
category_names = list(results.keys()) # 提取字典里面的类别(键-key)
data = np.array(list(results.values())) #提取字典里面的数值(值-value)
category_colors = plt.get_cmap('RdYlGn')(np.linspace(0.15, 0.85, data.shape[0]))
#设置占比显示的颜色,可以自定义,修改括号里面的参数即可,如下
#category_colors = plt.get_cmap('hot')(np.linspace(0.15, 0.85, data.shape[0]))
fig, ax = plt.subplots(figsize=(12, 9)) #创建画布,开始绘图
ax.invert_xaxis()#这个可以通过设置df中columns的顺序调整
ax.yaxis.set_visible(False) #设置y轴刻度不可见
ax.set_xticklabels(labels=labels, rotation=90) #显示x轴标签,并旋转90度
ax.set_ylim(0,1) #设置y轴的显示范围
starts = 0 #绘制基准
for i, (colname, color) in enumerate(zip(category_names, category_colors)):
heights = data[i,: ]/ data.sum(axis =0) #计算出每次遍历时候的百分比
ax.bar(labels, heights, bottom=starts, width=0.5,label=colname, color=color,edgecolor ='gray') # 绘制柱状图
xcenters = starts + heights/2 #进行文本标记位置的选定
starts += heights #核心一步,就是基于基准上的百分比累加
#print(starts) 这个变量就是能否百分比显示的关键,可以打印输出看一下
percentage_text = data[i,: ]/ data.sum(axis =0) #文本标记的数据
r, g, b, _ = color # 这里进行像素的分割
text_color = 'white' if r * g * b < 0.5 else 'k' #根据颜色基调分配文本标记的颜色
for y, (x, c) in enumerate(zip(xcenters, percentage_text)):
ax.text(y, x, f'{round(c*100,2)}%', ha='center', va='center',
color=text_color, rotation = 90) #添加文本标记
ax.legend(ncol=len(category_names), bbox_to_anchor=(0, 1),
loc='lower left', fontsize='large') #设置图例
return fig, ax #返回图像
比如把刚刚示例中的数据转化为DataFrame数据,如下
然后将df作为参数直接传递到percentage_bar函数中,看看结果输出,内部虽然设置x轴标签旋转90度,但是在函数外边还是可以直接调整其方向,这里就是取消旋转了,而且在最后的文本标记中采用的是百分比进行进标注的,这样更能清晰的明确各方的占比情况
3.2 代码试错
还是和最初一样,在最后一行数据的19后面添加一个0,变成190,这里顺带将y轴的刻度范围调整为(0,1.1),来查看是否符合百分比的要求,然后执行代码及输出结果如下
4. 实操检验
上面已经对函数进行了试错,无误后直接将函数放置到自己自定义的第三方模块下,方便自己调用,关于这步的操作,可以参考博客将自定义常用的一些函数封装成可以直接调用的模块方法
4.1 实操测试
4.2 更换标签
如果需要更换标签显示(df的标签与列标题互换),只需要将df转置即可,如下
4.3 部分标签输出
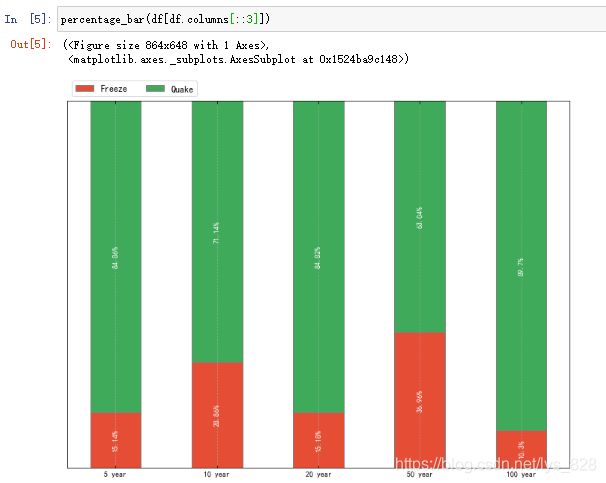
如果需要输出部分的标签,可以直接对df的columns进行切片即可(如果更换标签index转置之后也是同理),输出如下,比如这里只取两个标签
最后,梳理不易,码字分享希望能够帮助大家。
来源:oschina
链接:https://my.oschina.net/u/4273264/blog/4301312


