python中读取栅格数据
This article is meant to provide a quick introduction into how to use the Python package Rasterio for common tasks related to geospatial raster data. This is mainly a collection of things that took me too long to figure out myself, so I would like to share them with anyone who might be interested.
本文旨在快速介绍如何将Python软件包Rasterio用于与地理空间栅格数据有关的常见任务。 这主要是我花了很长时间才弄清楚自己的事情的集合,因此我想与任何有兴趣的人分享。
一些基础 (Some basics)
A map of any kind consists of features (representing, e.g., roads, buildings, different land types, surface water, etc.) that are projected in some way to a (typically planar) surface. These features can be represented as vector features (or generally shapes, e.g., lines describing roads, polygons describing building outlines) based on coordinates provided in some coordinate reference system (crs).
任何类型的图由被投影在某种方式为(典型地平面的)表面特征(表示,例如,道路,建筑物,不同土地类型,地表水,等)。 基于某些坐标参考系统中提供的坐标,这些特征可以表示为矢量特征(或通常的形状,例如,描述道路的线,描述建筑物轮廓的多边形) ( crs )。
raster data can be thought of as a picture of a map in the form of an array of pixels. Every pixel is mapped to a geospatial location based on an affine transformation and the underlying crs; the value of each pixel corresponds to some measure, e.g. the brightness of the area covered by the pixel in a specific wavelength range (as provided by some remote sensing instrument). The edges of the raster map in a given crs, are defined as the bounds of the raster map.
栅格数据可以看作是像素阵列形式的地图图片。 根据仿射变换将每个像素映射到地理空间位置 和潜在的CRS; 每个像素的值对应于某种度量,例如,像素在特定波长范围内覆盖的区域的亮度(由某些遥感仪器提供)。 给定crs中的栅格图的边缘定义为栅格图的边界。
Note that the representation of the raster data, its bounds, underlying transformation and crs are closely interrelated. Typically, if you plan on changing one or more of these parameters, this will affect the others, as well.
请注意,栅格数据的表示形式,其边界,基础转换和crs是紧密相关的。 通常,如果您计划更改这些参数中的一个或多个,这也会影响其他参数。
Rasterio helps you with this process.
Rasterio可帮助您完成此过程。
数据集 (Datasets)
GeoTiff is a typical image format for raster data. In case you don’t have a GeoTiff file handy, you can download one here; the following examples are based on this file. We can read in a GeoTiff file into a dataset, rasterio’s main data structure, using the following code:
GeoTiff是栅格数据的一种典型图像格式。 如果您没有随身携带的GeoTiff文件,可以在此处下载。 以下示例基于该文件。 我们可以使用以下代码将GeoTiff文件读入rasterio的主要数据结构的数据集:
import rasteriodataset = rasterio.open('sample.tif')data is called a dataset object, which carries some useful information, including:
data称为数据集对象,其中包含一些有用的信息,包括:
the underlying coordinate reference system:
基础坐标参考系统:
dataset.crs
CRS.from_epsg(32631)
EPSG:32631 is a local reference system that is used for parts of Europe. http://epsg.io provides information on most available coordinate reference systems. Crs coordinates are typically labeled x and y; in the case of EPSG:4326 (which is the same as WGS84) coordinates are provided in degrees in the common longitude and latitude definition.
EPSG:32631是用于欧洲部分地区的本地参考系统。 http://epsg.io提供有关大多数可用坐标参考系统的信息。 Crs坐标通常标记为x和y; 在EPSG:4326(与WGS84相同)的情况下,在共同的经度和纬度定义中以度为单位提供坐标。
the bounds of the raster data included in this dataset:
此数据集中包含的栅格数据的范围:
dataset.bounds
BoundingBox(left=590520.0, bottom=5780620.0, right=600530.0, top=5790630.0)
The numbers provided use the units as the dataset’s crs; in this specific case (EPSG:32631), the numbers define the map’s bounding box in units of meters relative to some origin that is defined by the crs. Other crs definitions may use other units, for instance degrees.
提供的数字使用单位作为数据集的crs; 在此特定情况下( EPSG:32631 ),数字以米为单位定义地图的边界框,相对于由crs定义的某个原点。 其他crs定义可以使用其他单位,例如度。
the affine transformation used in the current raster map representation:
当前栅格地图表示中使用的仿射变换:
dataset.transform
Affine(10.0, 0.0, 590520.0,
       0.0, -10.0, 5790630.0)
This transformation, implemented as an Affine object, defines how a change of 1 pixel in either direction (row or column) translates into crs coordinate changes using 6 parameters that are (in this order and all in the same units as the transformation’s crs): the change in x as a function of the change in pixel column (+10m for +1 pixel), the change in x as a function of the change in pixel row (0 in this case), the x coordinate origin (590520.0m), the change in y as a function of the change in pixel column (0 in this case), the change in y as a function of the change in pixel row (-10m for +1 pixel), and the y coordinate origin (5790630.0m here). You can consider the transformation to consist of two parts: a “rotation matrix” and the dataset’s crs coordinate origin (see the sketch at the top of this article).
作为Affine对象实现的此变换定义了使用6个参数(按此顺序且都与变换的crs相同的单位)在任一方向(行或列)上1像素的变化如何转换为crs坐标变化: x的变化作为像素列变化的函数(+1像素为+ 10m),x的变化作为像素行变化的函数(在这种情况下为0),x坐标原点(590520.0m) ,y的变化与像素列的变化(在这种情况下为0),y的变化与像素行的变化(对于+1像素为-10m)以及y坐标原点(5790630.0)我在这里)。 您可以认为转换由两部分组成:“旋转矩阵”和数据集的crs坐标原点(请参见本文顶部的草图)。
the number of bands or channels available for this raster map:
可用于此栅格地图的波段或通道数:
dataset.indexes
(1, 2, 3)
(In this case, 3 different bands are available; each band represents a grayscale map for a specific wavelength region. Note that rasterio starts counting bands at 1, unlike Python, for some reason.)
(在这种情况下,可以使用3个不同的波段;每个波段代表特定波长区域的灰度图。请注意,由于某些原因,rasterio开始从1开始对波段进行计数。)
We can read a specific band from the dataset into an array using
我们可以使用以下方法将数据集中的特定条带读取到数组中
img = dataset.read(i)where i is one of the indices provided by data.indexes. img is really just a numpy array; note that all available band arrays have the same shape (and thus also orientation and scaling) since they are sharing the same crs, transformation, and bounds.
其中i是data.indexes提供的索引data.indexes 。 img实际上只是一个小数组。 请注意,所有可用的波段数组都具有相同的形状(因此也具有方向和缩放比例),因为它们共享相同的crs,变换和边界。
Let’s plot our example image. We can use the rasterio.plot methods adjust_band, which normalizes the array values to a range from zero to one, and show, which creates and displays matplotlib axes. Note that we provide imgdata with the reverse index (or channel) order since dataset holds BGR channels, but we want to plot RGB:
让我们绘制示例图像。 我们可以使用rasterio.plot方法adjust_band ,该方法将数组值标准化为从零到一的范围,而show则创建并显示matplotlib轴。 请注意,由于dataset包含BGR通道,因此我们为imgdata提供了反向索引(或通道)顺序,但是我们想绘制RGB:
import numpy as np
from rasterio.plot import show, adjust_bandimgdata = np.array([adjust_band(dataset.read(i)) for i in (3,2,1)])
show(imgdata*3)  # factor 3 to increase brightness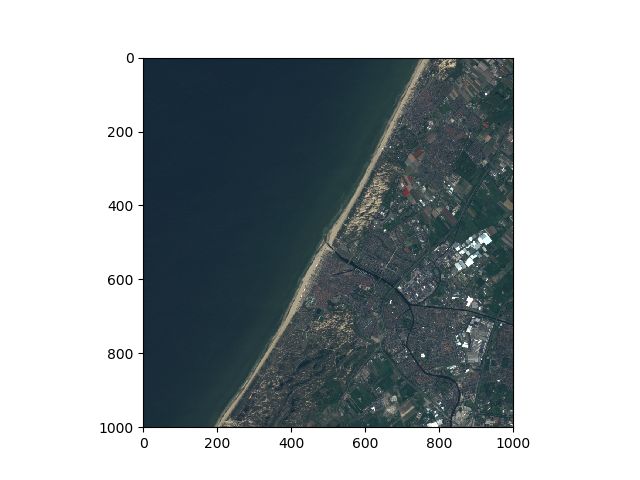
图像坐标和crs坐标之间的转换 (Transformations between image coordinates and crs coordinates)
Since we are dealing with geospatial data, we would like to be able to convert image coordinates to crs coordinates, and vice versa.
由于我们正在处理地理空间数据,因此我们希望能够将图像坐标转换为crs坐标,反之亦然。
For single pixels, you can go from image coordinates to crs coordinates using
对于单个像素,可以使用从图像坐标到CRS坐标
x, y = dataset.xy(row, column)where x and y refer to the crs coordinates of the center of the pixel located in rowand column of either of the bands in the dataset (note that row and column are not limited to integer values). Another method would be to simpy multiply your image coordinates with the actual transform of the dataset:
其中x和y是指位于数据集中任一波段的row和column中的像素中心的crs坐标(请注意, row和column不限于整数值)。 另一种方法是将图像坐标与数据集的实际变换进行简单乘积:
x, y = dataset.transform * (row, column)Keep in mind that both methods will give you slightly different results: the first method provides pixel center coordinates, whereas the second method gives you coordinates relative to the origin coordinates of the transform.
请记住,这两种方法都会为您提供稍有不同的结果:第一种方法提供像素中心坐标,而第二种方法则提供相对于变换原点坐标的坐标。
Finally, you can go from crs coordinates to image coordinates using
最后,您可以使用以下方法从crs坐标转换为图像坐标
row, column = dataset.index(x, y)不同坐标系之间的坐标转换 (Coordinate transformations between different coordinate systems)
If you have a set of coordinates in some coordinate system (defined by dataset.crs) and would like to transform them to new coordinate system:
如果您在某个坐标系中有一组坐标(由dataset.crs定义),并且希望将其转换为新的坐标系:
from rasterio.warp import transform
from rasterio.crs import CRSnew_crs = CRS.from_epsg(4326)   # standard WGS84 coordinatesnew_coo = transform(dataset.crs, new_crs,
                    xs=[590530], ys=[5790650])
new_coo
([4.326399074221181], [52.25878168834648])
向量特征在不同坐标系之间的转换 (Transformations of vector features between different coordinate systems)
Vector features can be defined as shapely objects. Let’s assume we are interested in defining a square region with an edge lengthedgelencentered around some coordinates x and y (based on the respective crs, its units, and the raster bounds). We define our region of interest (roi) as a shapely Polygon object:
矢量特征可以定义为形状对象。 假设我们感兴趣的是定义一个正方形区域,其边缘长度edgelen以一些坐标x和y为中心(基于各自的crs,其单位和栅格边界)。 我们将感兴趣的区域( roi )定义为匀称的Polygon对象:
from shapely.geometry import Polygonx, y, edgelen = 597667, 5787216, 1000  # based on EPSG:32631roi = Polygon([(x - int(edgelen / 2), y + int(edgelen / 2)),
               (x + int(edgelen / 2), y + int(edgelen / 2)),
               (x + int(edgelen / 2), y - int(edgelen / 2)),
               (x - int(edgelen / 2), y - int(edgelen / 2))])print(roi)
POLYGON ((590030 5791150, 591030 5791150, 591030 5790150, 590030 5790150, 590030 5791150))
If you print a shape, it is presented to you using the Well-known-text representation of geometry.
如果您打印形状,则使用众所周知的几何图形表示形式来显示形状。
Let’s now assume that we defined roi (i.e., x and y coordinates and edgelen) based on crs1 but we would like to transform the Polygon to crs2:
现在,假设我们基于crs1定义了roi (即x和y坐标以及edgelen ),但是我们想将Polygon转换为crs2 :
from rasterio.crs import CRS
from rasterio.warp import transform_geocrs1 = CRS.from_epsg(32631)
crs2 = CRS.from_epsg(4326)roi2 = transform_geom(crs1, crs2, roi)
roi2
{'type': 'Polygon',
 'coordinates': [[(4.319208814194372, 52.26335783407589),
   (4.333857524152045, 52.26319323507531),
   (4.3335878545153586, 52.254205111266934),
   (4.31894210402294, 52.254369657266636),
   (4.319208814194372, 52.26335783407589)]]}
裁剪栅格数据 (Cropping raster data)
In order to crop raster data, rasterio.mask.mask masks those areas of the image that you want removed and then removes them for you (if you set the keyword argument crop=True):
为了裁剪栅格数据, rasterio.mask.mask遮罩您要删除的图像区域,然后为您删除它们(如果您设置了关键字参数crop=True ):
from rasterio.mask import maskcrop_img, crop_transform = mask(dataset, shapes=[roi], crop=True)shape denotes here a “GeoJSON-like dict or an object that implements the Python geo interface protocol” (see documentation) and defines the area you are interested in. We can simply use our roi polygon here again.
shape在这里表示“类似于GeoJSON的字典或实现Python地理接口协议的对象”(请参阅文档),并定义了您感兴趣的区域。我们可以在这里再次简单地使用roi多边形。
Let’s see which part from the image has been cropped (we use crop_img[::-1] to reverse the original channel order in our sample file, BGR, to RGB):
让我们看看图像中的哪一部分已被裁剪(我们使用crop_img[::-1]将示例文件BGR中的原始通道顺序反转为RGB):
crop_img = adjust_band(crop_img)
show(crop_img[::-1]) 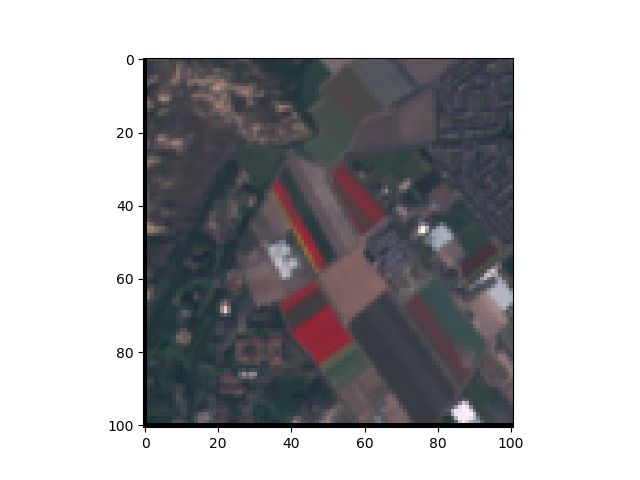
重采样栅格数据 (Resampling raster data)
Sometimes you have to resample your raster data, for instance, in order to match the resolutions of different imaging channels. Resampling is best performed on raster data that is available in a file, so it actually does make sense to write any data that you might have in your memory to a file first and the apply the following code (which is adopted from the rasterio documentation):
例如,有时您必须重新采样栅格数据,以匹配不同成像通道的分辨率。 重采样最好在文件中可用的栅格数据上执行,因此,将内存中可能有的任何数据首先写入文件并应用以下代码(从rasterio文档采用)实际上确实有意义。 :
from rasterio.enums import Resamplingresample_factor = 0.5 # >1: upsample, <1: downsample
with rasterio.open('sample.tif') as dataset:
imgdata = dataset.read(out_shape=(dataset.count,
int(dataset.height * resample_factor),
int(dataset.width * resample_factor)),
resampling=Resampling.bilinear)
transform = dataset.transform * dataset.transform.scale(
(dataset.width / imgdata.shape[-1]),
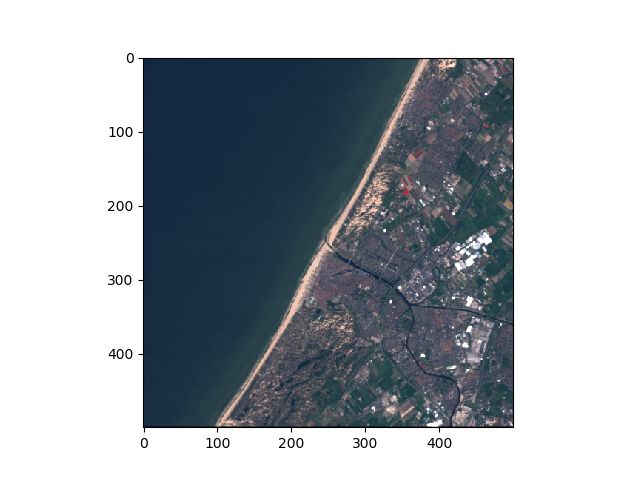
(dataset.height / imgdata.shape[-2]))This example code will resample all bands in the dataset and derive a new transform. For more information, please refer to the relevant rasterio documentation. This is the resampled image:
此示例代码将重新采样数据集中的所有波段,并得出一个新的transform 。 有关更多信息,请参考相关的rasterio文档。 这是重新采样的图像:
重新投影栅格数据 (Reprojecting raster data)
Reprojection means to find a new representation for your raster data based on a different crs (i.e., other coordinate system), a different transform (e.g., to rotate the raster), or different bounds. This may include rotations and distortions, making reprojections rather complex
重投影意味着根据不同的crs(即,其他坐标系),不同的变换(例如,旋转栅格)或不同的边界为栅格数据找到新的表示形式。 这可能包括旋转和扭曲,使重投影相当复杂
The following code simply reprojects the given dataset into a new crs (new_crs) with any alterations to the underlying transformation. The code reads in a dataset, derives a new transformation, raster height and width, creates an array for the reprojected data (new_imgdata) and finally performs the reprojection:
以下代码仅将给定的数据集重新投影到新的crs( new_crs )中,并且对基础转换进行了任何更改。 该代码读取数据集,得出新的变换,栅格高度和宽度,为重新投影的数据( new_imgdata )创建一个数组,最后执行重新投影:
from rasterio.warp import calculate_default_transform, reprojectnew_crs = CRS.from_epsg(4326) # WGS84with rasterio.open('sample.tif') as dataset:
new_transform, width, height = calculate_default_transform(
dataset.crs, new_crs,
dataset.width, dataset.height, *dataset.bounds)
imgdata = np.array([dataset.read(i) for i in dataset.indexes])
new_imgdata = np.zeros(imgdata.shape)
reproject(source=imgdata,
destination=new_imgdata,
src_transform=dataset.transform,
src_crs=dataset.crs,
dst_transform=new_transform,
dst_crs=new_crs,
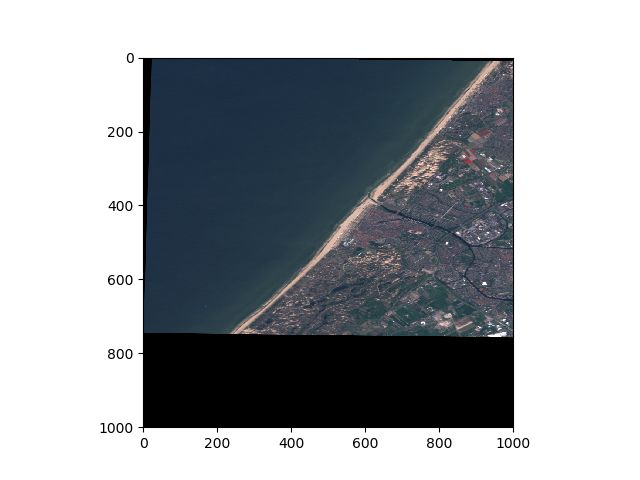
resampling=Resampling.nearest)This is our reprojected sample.tif file:
这是我们重新投影的sample.tif文件:
翻译自: https://medium.com/@mommermiscience/dealing-with-geospatial-raster-data-in-python-with-rasterio-775e5ba0c9f5
python中读取栅格数据