GSE181279—AD疾病的PBMC单细胞 单细胞数据分析实战
G:\silicosis\jimmy_task_study\2023_jimmy_scrna\00-现在完成的\2021-GSE181279-AD疾病的PBMC单细胞
本次分析结果来自生信技能书的春节大放送活动。
文章整体设计

step1 导入数据
###### step1:导入数据 ######
# 付费环节 800 元人民币

dir='GSE181279_RAW/outputs'
samples=list.files( dir )
samples
str_split(samples,pattern = "_",simplify = T)[,2]
table(str_split(samples,pattern = "_",simplify = T)[,2])

getwd()
list.files(recursive = T)

# samples = head(samples,10)
sceList = lapply(samples,function(pro){
  # pro=samples[1]
  print(pro)
  sce =CreateSeuratObject(counts =  Read10X(file.path(dir,pro)) ,
                          project =gsub('^GSM[0-9]*_','',pro)  ,
                          a,
                          min.cells = 5,
                          min.features = 500 )
  return(sce)
  names(sce)=gsub('^GSM[0-9]*_','',pro)#我自己加上的 很有用
})
names(sceList)

#for (i in 1:5){
  #i=1
  names(sceList)=Project(sceList[[i]]) }

names(sceList)
str(sceList)
sceList[[1]]
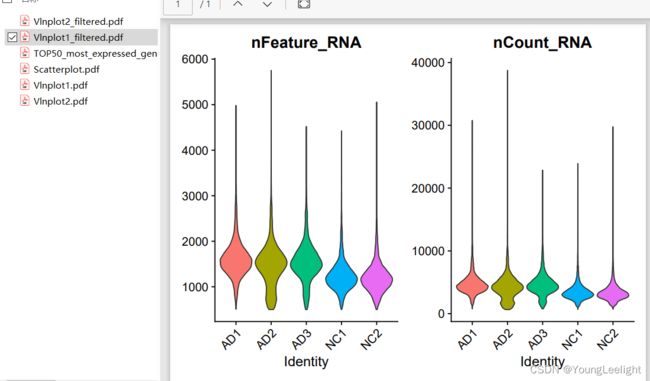
step2:QC质控 ######
###### step2:QC质控 ######
dir.create("./1-QC")
setwd("./1-QC")
getwd()
# 如果过滤的太狠,就需要去修改这个过滤代码
source('../scRNA_scripts/qc.R')
sce.all.filt = basic_qc(sce.all)
print(dim(sce.all))
print(dim(sce.all.filt))
setwd('../')
getwd()
结果展示和分析

0.91的相关性 挺好 标准的三张图

类似于scanpy 查看top50高边基因

step3: harmony整合多个单细胞样品 ######
###### step3: harmony整合多个单细胞样品 ######
dir.create("2-harmony")
getwd()
setwd("2-harmony")
getwd()
source('../scRNA_scripts/harmony.R')
# 默认 ScaleData 没有添加"nCount_RNA", "nFeature_RNA"
# 默认的
sce.all.int = run_harmony(sce.all.filt)
setwd('../')

不同分辨率下的聚类情况 看上去分的还是挺开的


step4: 降维聚类分群和看标记基因库 ######
step4: 降维聚类分群和看标记基因库 ######
# 原则上分辨率是需要自己肉眼判断,取决于个人经验
# 为了省力,我们直接看  0.1和0.8即可
table(Idents(sce.all.int))
table(sce.all.int$seurat_clusters)
table(sce.all.int$RNA_snn_res.0.1)
table(sce.all.int$RNA_snn_res.0.8)

getwd()
dir.create('check-by-0.1')
setwd('check-by-0.1')
sel.clust = "RNA_snn_res.0.1"
sce.all.int <- SetIdent(sce.all.int, value = sel.clust)
table([email protected])
sp='human'
source('../scRNA_scripts/check-all-markers.R')
setwd('../')
getwd()
0.8分辨率
dir.create('check-by-0.8')
setwd('check-by-0.8')
sel.clust = "RNA_snn_res.0.8"
sce.all.int <- SetIdent(sce.all.int, value = sel.clust)
table([email protected])
source('../scRNA_scripts/check-all-markers.R')
setwd('../')
getwd()

last_markers_to_check
根据harmony步骤 看上去先选择0.8的分辨率 一共16群细胞
其实我感觉选择0.3就够用了 因此这个数据集是pbmc 这里面全是血细胞。大致可以分为髓系细胞:单核 巨噬细胞 中性粒(shisuanshijian) 肥大细胞
淋巴系细胞:cd4、cd8 t细胞 b细胞 nk细胞 treg细胞
大致血里面就10-16种细胞的吧如果细分的话0.8够用了
我还是先选0.1的分辨率吧 可以聚类成6个 先做过粗犷的分群
#定义细胞亚群
  celltype[celltype$ClusterID %in% c( 0,1),2]='T'
 # celltype[celltype$ClusterID %in% c( 1),2]='CD8'
  #celltype[celltype$ClusterID %in% c( 5,6 ),2]='Mono'
  celltype[celltype$ClusterID %in% c( 2 ,6),2]='B cells'
  celltype[celltype$ClusterID %in% c(  3,4,5 ),2]='Myeloids'
# celltype[celltype$ClusterID %in% c( 4 ),2]='Mono/Macro' 

step5: 确定单细胞亚群生物学名字 ###### 根据上图 最终确定如下:

结果太粗了 后面如果以此为课题需要细化分辨率 。我估计nk细胞和t细胞混杂在一起了
step5: 确定单细胞亚群生物学名字 ######
# 一般来说,为了节省工作量,我们选择0.1的分辨率进行命名
# 因为命名这个步骤是纯人工 操作
# 除非0.1确实分群太粗狂了,我们就选择0.8
source('scRNA_scripts/lib.R')
sce.all.int = readRDS('2-harmony/sce.all_int.rds')
phe
getwd()
# 付费环节 800 元人民币
if(F){
  sce.all.int
  table(sce.all.int$RNA_snn_res.0.1)
  celltype=data.frame(ClusterID=0:6 ,#根据最后聚类成多少个
                      celltype= 0:6)
  celltype
  #定义细胞亚群
  celltype[celltype$ClusterID %in% c( 0,1),2]='T'
 # celltype[celltype$ClusterID %in% c( 1),2]='CD8'
  #celltype[celltype$ClusterID %in% c( 5,6 ),2]='Mono'
  celltype[celltype$ClusterID %in% c( 2 ,6),2]='B cells'
  celltype[celltype$ClusterID %in% c(  3,4,5 ),2]='Myeloids'
 # celltype[celltype$ClusterID %in% c( 4 ),2]='Mono/Macro'
  head(celltype)
  celltype
  table(celltype$celltype)
  [email protected]$celltype = "NA"

  for(i in 1:nrow(celltype)){
    [email protected][which([email protected]$RNA_snn_res.0.1 == celltype$ClusterID[i]),'celltype'] <- celltype$celltype[i]}
  Idents(sce.all.int)=sce.all.int$celltype

  table(sce.all.int$celltype)
  sel.clust = "celltype"
  sce.all.int <- SetIdent(sce.all.int, value = sel.clust)
  table([email protected])

  dir.create('check-by-celltype')
  setwd('check-by-celltype')
  source('../scRNA_scripts/check-all-markers.R')
  setwd('../')
  getwd()
}
###### step6: 单细胞亚群比例差异 ######
# 付费环节 800元人民币
###### step7: 单细胞亚群表达量差异分析 ######
# 付费环节 800 元人民币
