LSTM详解
LSTM详解
1.RNN
循环神经网络的基本原理参考
1.1 RNN构造过程
RNN是一种特殊的神经网路结构,其本身是包含循环的网络,允许信息在神经元之间传递,如下图所示:
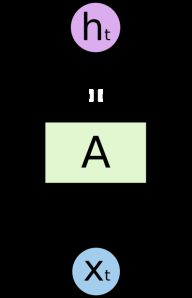


这样链式的结构揭示了RNN本质上是与序列相关的,是对于时间序列数据最自然的神经网络架构。并且理论上,RNN可以保留以前任意时刻的信息。RNN在语音识别、自然语言处理、图片描述、视频图像处理等领域已经取得了一定的成果,而且还将更加大放异彩。但普通RNN存在梯度爆照和梯度消失的问题。
1.2 RNN局限
RNN利用了神经网络的“内部循环”来保留时间序列的上下文信息,可以使用过去的信号数据来推测对当前信号的理解,这是非常重要的进步,并且理论上RNN可以保留过去任意时刻的信息。但实际使用RNN时往往遇到问题,请看下面这个例子。
假如我们构造了一个语言模型,可以通过当前这一句话的意思来预测下一个词语。现在有这样一句话:“我是一个中国人,出生在普通家庭,我最常说汉语,也喜欢写汉字。我喜欢妈妈做的菜”。我们的语言模型在预测“我最常说汉语”的“汉语”这个词时,它要预测“我最常说”这后面可能跟的是一个语言,可能是英语,也可能是汉语,那么它需要用到第一句话的“我是中国人”这段话的意思来推测我最常说汉语,而不是英语、法语等。而在预测“我喜欢妈妈做的菜”的最后的词“菜”时并不需要“我是中国人”这个信息以及其他的信息,它跟我是不是一个中国人没有必然的关系
这个例子告诉我们,想要精确地处理时间序列,有时候我们只需要用到最近的时刻的信息。例如“菜”这个词与“我”、“喜欢”、“妈妈”、“做”、“的”这几个词关联性比较大,距离也比较近,所以可以直接利用这几个词进行最后那个词语的推测。
而有时候我们又需要用到很早以前时刻的信息,例如预测“我最常说汉语”最后的这个词“汉语”。仅仅依靠“我”、“最”、“常”、“说”这几个词还不能得出我说的是汉语,必须要追溯到更早的句子“我是一个中国人”,由“中国人”这个词语来推测我最常说的是汉语。就需要向前追溯更多的信息才能进行正确合理的推测。
而RNN虽然在理论上可以保留所有历史时刻的信息,但在实际使用时,信息的传递往往会因为时间间隔太长而逐渐衰减,传递一段时刻以后其信息的作用效果就大大降低了。因此,普通RNN对于信息的长期依赖问题没有很好的处理办法。
2.长短时间记忆网络(LSTM)
2.1 LSTM与RNN的关系
长短期记忆(Long Short Term Memory,LSTM)网络是一种特殊的RNN模型,其特殊的结构设计使得它可以避免长期依赖问题,记住很早时刻的信息是LSTM的默认行为,而不需要专门为此付出很大代价。
普通的RNN模型中,其重复神经网络模块的链式模型如下图所示,这个重复的模块只有一个非常简单的结构,一个单一的神经网络层(例如tanh层),这样就会导致信息的处理能力比较低。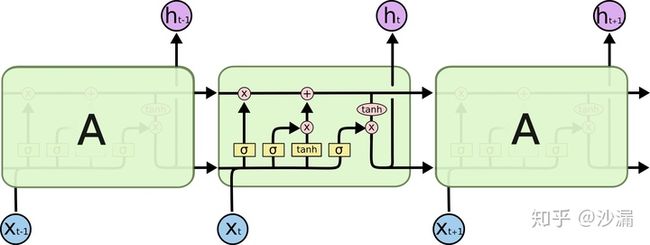
而LSTM在此基础上将这个结构改进了,不再是单一的神经网络层,而是4个,并且以一种特殊的方式进行交互。
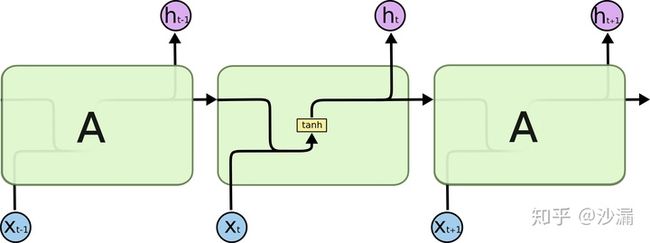
- 黄色方块:表示一个神经网络层(Neural Network Layer);
- 粉色圆圈:表示按位操作或逐点操作(pointwise operation),例如向量加和、向量乘积等;
- 单箭头:表示信号传递(向量传递);
- 合流箭头:表示两个信号的连接(向量拼接);
- 分流箭头:表示信号被复制后传递到2个不同的地方
2.2 LSTM的基本思想
LSTM的关键是细胞状态Ct,用来保存当前LSTM的状态信息并传递到下一时刻的LSTM中。当前的LSTM接收来自上一个时刻的细胞状态,并与当前LSTM接收的信号输入共同作用产生当前LSTM的细胞状态 Ct。
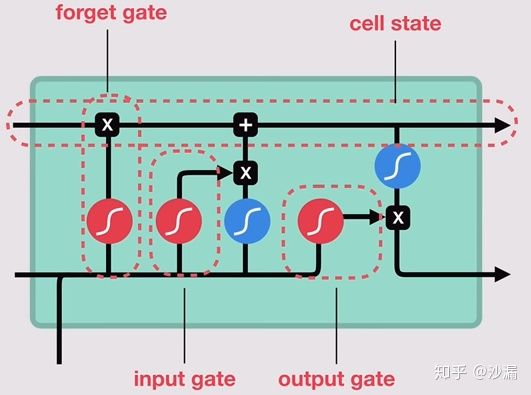
在LSTM中,采用专门设计的“门”来引入或者去除细胞状态中的信息。门是一种让信息选择性通过的方法。有的门跟信号处理中的滤波器有点类似,允许信号部分通过或者通过时被门加工了;有的门也跟数字电路中的逻辑门类似,允许信号通过或者不通过。这里所采用的门包含一个 sigmoid 神经网络层和一个按位的乘法操作,如下图所示
LSTM主要包括三个不同的门结构:遗忘门、记忆门和输出门。这三个门用来控制LSTM的信息保留和传递。如下图所示:
2.3 遗忘门
遗忘门的作用就是用来“忘记”信息的。在LSTM的使用过程中,有一些信息不是必要的,因此遗忘门的作用就是用来选择这些信息并“忘记”它们。(筛选信息)

其中黄色方块表示sigmoid神经网络层,粉色圆圈表示按位乘法操作。神经网络层可以将输入信号转换为 0 到 1之间的数值,用来描述有多少量的输入信号可以通过。0表示“不允许任何量通过”,1 表示“允许所有量通过”。
2.4 记忆门
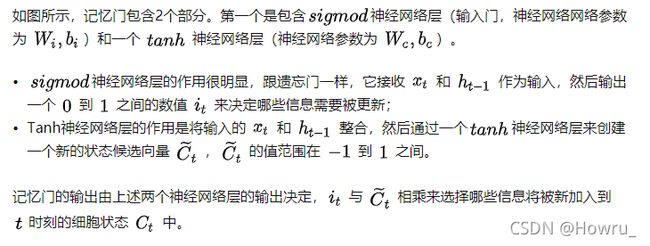
记忆门的作用与遗忘门相反,它将决定新输入的信息 xt 和ht-1中哪些信息将被保留。

2.5 更新细胞状态
2.6 输出门
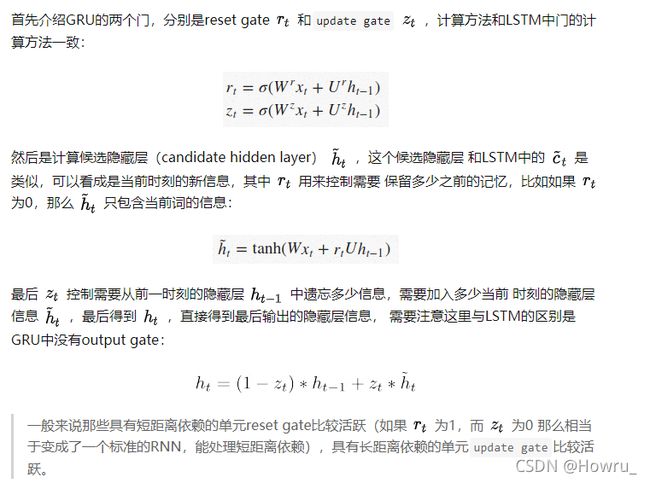
3 GRU
4.基于pytorch的实现
使用正弦函数和余弦函数来构造时间序列,而正余弦函数之间是成导数关系,所以我们可以构造模型来学习正弦函数与余弦函数之间的映射关系,通过输入正弦函数的值来预测对应的余弦函数的值。
我们取正弦函数的值作为LSTM的输入,来预测余弦函数的值。基于Pytorch来构建LSTM模型,采用1个输入神经元,1个输出神经元,16个隐藏神经元作为LSTM网络的构成参数,平均绝对误差(LMSE)作为损失误差,使用Adam优化算法来训练LSTM神经网络。基于Anaconda和Python3.6的完整代码如下
import numpy as np
import torch
from torch import nn
import matplotlib.pyplot as plt

# Define LSTM Neural Networks
class LstmRNN(nn.Module):
    """
        Parameters:
        - input_size: feature size
        - hidden_size: number of hidden units
        - output_size: number of output
        - num_layers: layers of LSTM to stack
    """
    def __init__(self, input_size, hidden_size=1, output_size=1, num_layers=1):
        super().__init__()

        self.lstm = nn.LSTM(input_size, hidden_size, num_layers) # utilize the LSTM model in torch.nn
        self.forwardCalculation = nn.Linear(hidden_size, output_size)

    def forward(self, _x):
        x, _ = self.lstm(_x)  # _x is input, size (seq_len, batch, input_size)
        s, b, h = x.shape  # x is output, size (seq_len, batch, hidden_size)
        x = x.view(s*b, h)
        x = self.forwardCalculation(x)
        x = x.view(s, b, -1)
        return x

if __name__ == '__main__':
    # create database
    data_len = 200
    t = np.linspace(0, 12*np.pi, data_len)
    sin_t = np.sin(t)
    cos_t = np.cos(t)

    dataset = np.zeros((data_len, 2))
    dataset[:,0] = sin_t
    dataset[:,1] = cos_t
    dataset = dataset.astype('float32')

    # plot part of the original dataset
    plt.figure()
    plt.plot(t[0:60], dataset[0:60,0], label='sin(t)')
    plt.plot(t[0:60], dataset[0:60,1], label = 'cos(t)')
    plt.plot([2.5, 2.5], [-1.3, 0.55], 'r--', label='t = 2.5') # t = 2.5
    plt.plot([6.8, 6.8], [-1.3, 0.85], 'm--', label='t = 6.8') # t = 6.8
    plt.xlabel('t')
    plt.ylim(-1.2, 1.2)
    plt.ylabel('sin(t) and cos(t)')
    plt.legend(loc='upper right')

    # choose dataset for training and testing
    train_data_ratio = 0.5 # Choose 80% of the data for testing
    train_data_len = int(data_len*train_data_ratio)
    train_x = dataset[:train_data_len, 0]
    train_y = dataset[:train_data_len, 1]
    INPUT_FEATURES_NUM = 1
    OUTPUT_FEATURES_NUM = 1
    t_for_training = t[:train_data_len]

    # test_x = train_x
    # test_y = train_y
    test_x = dataset[train_data_len:, 0]
    test_y = dataset[train_data_len:, 1]
    t_for_testing = t[train_data_len:]

    # ----------------- train -------------------
    train_x_tensor = train_x.reshape(-1, 5, INPUT_FEATURES_NUM) # set batch size to 5
    train_y_tensor = train_y.reshape(-1, 5, OUTPUT_FEATURES_NUM) # set batch size to 5

    # transfer data to pytorch tensor
    train_x_tensor = torch.from_numpy(train_x_tensor)
    train_y_tensor = torch.from_numpy(train_y_tensor)
    # test_x_tensor = torch.from_numpy(test_x)

    lstm_model = LstmRNN(INPUT_FEATURES_NUM, 16, output_size=OUTPUT_FEATURES_NUM, num_layers=1) # 16 hidden units
    print('LSTM model:', lstm_model)
    print('model.parameters:', lstm_model.parameters)

    loss_function = nn.MSELoss()
    optimizer = torch.optim.Adam(lstm_model.parameters(), lr=1e-2)

    max_epochs = 10000
    for epoch in range(max_epochs):
        output = lstm_model(train_x_tensor)
        loss = loss_function(output, train_y_tensor)

        loss.backward()
        optimizer.step()
        optimizer.zero_grad()

        if loss.item() < 1e-4:
            print('Epoch [{}/{}], Loss: {:.5f}'.format(epoch+1, max_epochs, loss.item()))
            print("The loss value is reached")
            break
        elif (epoch+1) % 100 == 0:
            print('Epoch: [{}/{}], Loss:{:.5f}'.format(epoch+1, max_epochs, loss.item()))

    # prediction on training dataset
    predictive_y_for_training = lstm_model(train_x_tensor)
    predictive_y_for_training = predictive_y_for_training.view(-1, OUTPUT_FEATURES_NUM).data.numpy()

    # torch.save(lstm_model.state_dict(), 'model_params.pkl') # save model parameters to files

    # ----------------- test -------------------
    # lstm_model.load_state_dict(torch.load('model_params.pkl'))  # load model parameters from files
    lstm_model = lstm_model.eval() # switch to testing model

    # prediction on test dataset
    test_x_tensor = test_x.reshape(-1, 5, INPUT_FEATURES_NUM) # set batch size to 5, the same value with the training set
    test_x_tensor = torch.from_numpy(test_x_tensor)

    predictive_y_for_testing = lstm_model(test_x_tensor)
    predictive_y_for_testing = predictive_y_for_testing.view(-1, OUTPUT_FEATURES_NUM).data.numpy()

    # ----------------- plot -------------------
    plt.figure()
    plt.plot(t_for_training, train_x, 'g', label='sin_trn')
    plt.plot(t_for_training, train_y, 'b', label='ref_cos_trn')
    plt.plot(t_for_training, predictive_y_for_training, 'y--', label='pre_cos_trn')

    plt.plot(t_for_testing, test_x, 'c', label='sin_tst')
    plt.plot(t_for_testing, test_y, 'k', label='ref_cos_tst')
    plt.plot(t_for_testing, predictive_y_for_testing, 'm--', label='pre_cos_tst')

    plt.plot([t[train_data_len], t[train_data_len]], [-1.2, 4.0], 'r--', label='separation line') # separation line

    plt.xlabel('t')
    plt.ylabel('sin(t) and cos(t)')
    plt.xlim(t[0], t[-1])
    plt.ylim(-1.2, 4)
    plt.legend(loc='upper right')
    plt.text(14, 2, "train", size = 15, alpha = 1.0)
    plt.text(20, 2, "test", size = 15, alpha = 1.0)

    plt.show()


