ggplot常用参数汇总
作者 | 缪恒
来源 | 量化小城
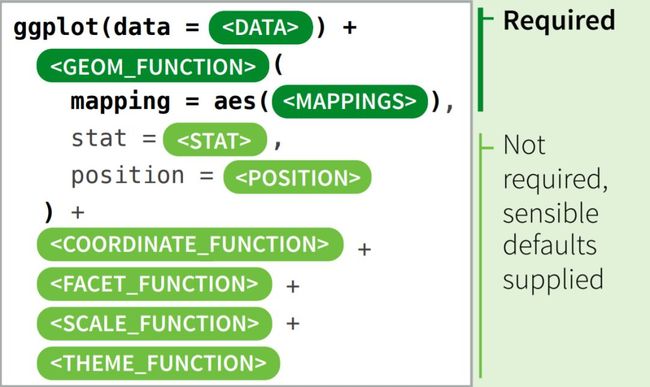
ggplot整体输入框架:
0 1geom_pointggplot(data =....) +
geom_point(aes(x =..., y =..., color =(类别)..., size =..., alpha(透明度) =...), color =..., shape =..., position ="jitter", ...) + ...
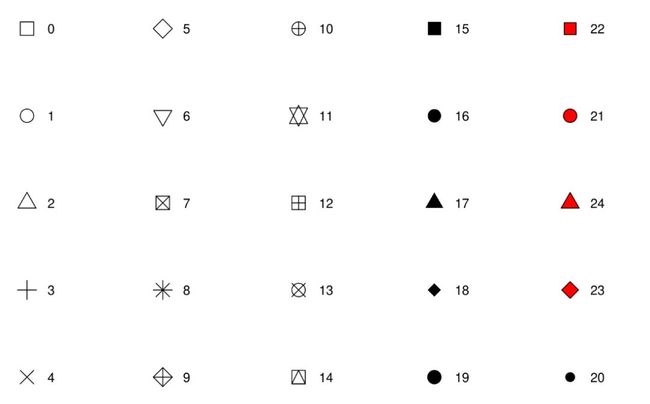
shape样式:
02geom_smoothggplot(data =....) +
geom_smooth(aes(x =..., y =..., color =(类别)..., linetype =..., group =...,), color =..., size =..., linetype =..., method ="lm",..., formula =..., se = TRUE(展示confidence interval)) + ...
分组线条:
ggplot(data =....) +
geom_line(aes(x =..., y =..., color =(类别)..., linetype =..., group =...,), color =..., size =..., alpha =..., linetype ="...") + ...
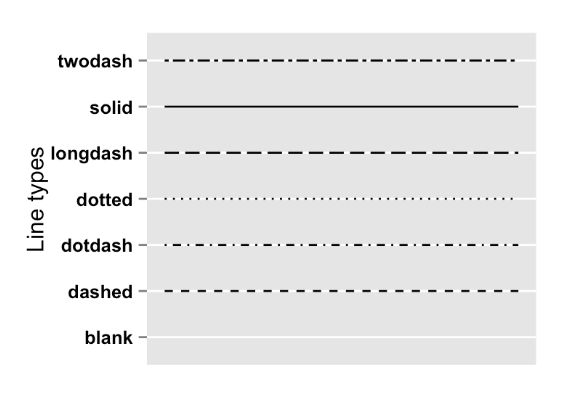
linetype样式:
特定多组线条:
ggplot(data =...., aes(x =...)) +
geom_line(aes(y =..., color =(标签名称)...), size =..., linetype =...) +
geom_line(aes(y =..., color =(标签名称)...), size =..., linetype =...) +
scale_color_brewer(name =..., palette =...) + ...
ggplot(data =....) +
geom_bar(aes(x =..., or y =..., color =(类别)..., fill =...), position ="identity", "fill", "dodge", binwidth =..., color =..., fill =..., size =..., linetype ="...") + ...
ggplot(data =....) +
geom_histogram(aes(x =..., or y =..density.., color =(类别)..., fill =...), position ="identity", "fill", "dodge", "jitter", "stack", binwidth =..., bins =..., color =..., fill =..., size =..., linetype ="...") + ...
ggplot(data =....) +
geom_boxplot(aes(x =..., y =..., color =(类别)..., fill =...), fill =..., notch = TRUE, varwidth =TRUE, outlier.colour =..., outlier.shape =..., stat =...) + ...
ggplot(data =....) +
geom_area(aes(x =..., or y =..density.., color =(类别)..., fill =...), stat ="bin", fill =..., color =..., linetype =...) + ...
08geom_polygon
ggplot(data =....) +
geom_polygon(aes(x =..., y =..., group =..., fill =..., color =...), linetype =...) + ...
ggplot(data =....) +
geom_text(aes(x =..., y =..., label =...,color =(类别)...), data =..., size =..., check_overlap =TRUE, hjust =..., vjust = ..., angle =..., color =...) + ...
ggplot(data =....) +
geom_tile(aes(x =..., y =..., group =..., fill =...)) + ...
ggplot(data =....) +
geom_jitter(aes(x =..., y =..., color =(类别)...), position ="jitter", color =..., alpha =..., size =..., width =...) + ...
ggplot(data =....) +
geom_hline(yintercept =..., linetype =..., color =..., size =...) /
geom_vline(xintercept =..., linetype =..., color =..., size =...) /
geom_abline(intercept =..., slope =..., linetype =..., color =..., size =...) / + ...
离散型:
scale_x_discrete("坐标轴名称", labels=c("..."="...",...), limits =c(...), breaks =c(...))
连续型:
scale_x_continuous("坐标轴名称",labels=c(...),limits =c(...), breaks =c(...))
library(scale)
scale_x_date(breaks=date_break("1 year"), limits=as.Date(c(...)), labels=date_format("%Y-%m-%d"))
离散型:
scale_color_manual("图例名称", values =c("名称" = "颜色",...)
scale_fill_manual("图例名称", values =c("名称" = "颜色",...)
scale_color_brewer(name="...", palette ="...")
scale_fill_brewer(name="...", palette ="...")
palette样式:
连续型:
scale_color_gradient(low="...", high ="...")
scale_fill_gradient(limits =c(...), low ="...", high ="...")
scale_fill_gradient2(low ="...", high ="...", mid ="...", midpoint =...)
element_text(size =..., color =..., face ="bold", angle =..., hjust =..., vjust =...,)
element_line(size =..., color =..., linetype= ...)
element_rect(size =..., color =..., linetype= ..., fill =...)
element_blank()
放大zooming:
coord_cartesian(xlim =c(,), ylim =c(,), expand =TRUE, default =FALSE, clip ="on")
加标题快捷法:
labs(x ="...", y ="...", title ="...")
坐标轴互换:
coord_flip()
图例位置:
theme(legend.position ="top","bottom","left","right")
添加任意方程:
stat_function(fun =..., args =list(,), color =..., size =...)
——————————————
往期精彩:
美国“实体清单”再度升级,我国超级计算机今日起或面临“断供”!
我造的假我自己打,Adobe推出“反PS”
微软删除人脸识别,除了隐私,更重要的可能是性别歧视与种族主义
![]()


