R语言自学笔记:作图基础(plot、ggplot)
一.plot
1. 使用plot以散点图为例
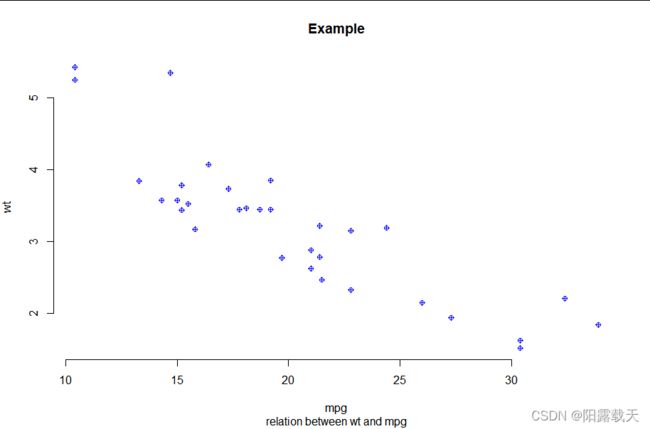
系统自带的函数,用于作图,例如对mtcars中某两列的数据绘制散点图。
> with(mtcars,plot(mpg, wt, type = "p", main = "Example",
+ sub = "relation between wt and mpg",
+ xlab = "mpg", ylab = "wt", col = "blue",
+ xlim = range( mpg ), ylim = range( wt ),
+ pch = 10, frame.plot = F))
注:pch对应的是散点的形状;type对应不同的作图类型,例如‘p’代表完全的散点图
作图完毕后,还可以用以下几个函数对其进行数据内容的扩充,使用方法为:+(函数):
会在已作的图片上加上补充的内容。
2. 参数及参数的调整
save <- par();

## reload
par( oldpar );
(1) mar
可以通过par(mar = ....),向mar内部输入含有四个数值的向量,分别代表下左上右的边距。
(2) mfrow
修改连续作图时的排布情况:
> par(mfrow = c(3,1))
> for (i in 1:3) {
+     plot(1:10)
(3) 图形设备设置
图形设备即为指图形输出的设备,可以理解为输出图片保存格式,如:png、jpg。
pdf( file = "/path/", height = , width =  )
## 作图操作 ##
dev.off() ##关闭设备,返回最近的使用的一个设备
二. ggplot
ggplot的基础由四个概念(部分)组成:图层、绘图设计、坐标轴控制和分面。ggplot是一个强大的绘图工具,除内部整合的各种参数和函数,许多包也与之有配合,使用时记忆难度较高。自学时只为快速上手,简单记录一下几个基本的图像的画法和几个基本函数的使用。
1. 基本参数
ggplot的help()内容基本如下:
Description
ggplot() initializes a ggplot object. It can be used to declare the input data frame for a graphic and to specify the set of plot aesthetics intended to be common throughout all subsequent layers unless specifically overridden.

Usage
ggplot(data = NULL, mapping = aes(), ..., environment = parent.frame())

Arguments
data
Default dataset to use for plot. If not already a data.frame, will be converted to one by fortify(). If not specified, must be supplied in each layer added to the plot.

mapping
Default list of aesthetic mappings to use for plot. If not specified, must be supplied in each layer added to the plot.

...
Other arguments passed on to methods. Not currently used.

environment
DEPRECATED. Used prior to tidy evaluation.
使用时函数的基本使用方法如下:
ggplot(dataframe, aes(x = ..., y = ..., color = ..., fill = ..., 以及各种与mapping相关的参数) )
x = 控制x轴内容
y = 控制y轴内容
color = 控制颜色
...
注意,在aes()中,所有的内容的分配都是将变量视为factor,依据其level来发挥功能。
例如:
> ggplot(mtcars,aes(x = rownames(mtcars),y = mpg,color = cyl , fill = cyl))+
    geom_histogram(stat= "identity")
由图可见,fill和color的判别是通过cyl的levels来决定的,更加直观第可以写为:
ggplot(mtcars,aes(x = rownames(mtcars),y = mpg, fill = factor(cyl)))+geom_histogram(stat= "identity")同时,对于坐标而言,修改x轴对应的数据的factor的顺序可以直接改变图中各个值的顺序。
2. 图层(geom_...)
ggplot(mtcars,aes(x = cyl,y = wt, fill = rownames(mtcars)))+
    geom_bar(stat= "identity",position = "stack")
ggplot(mtcars,aes(x = cyl,y = wt, fill = rownames(mtcars)))+
geom_bar(stat= "identity",position = "dodge")ggplot(income.dat, aes(x = income.predict, y = income))+
geom_point(size = 2) +
geom_text(data = NULL, aes(x = 8, y = 8), parse = T, label = R2 )+ ##在8,8处写上一个R2。label需要输入的是一个字符类型的变量
geom_abline(intercept = 0, slope = 1, colour = "red")
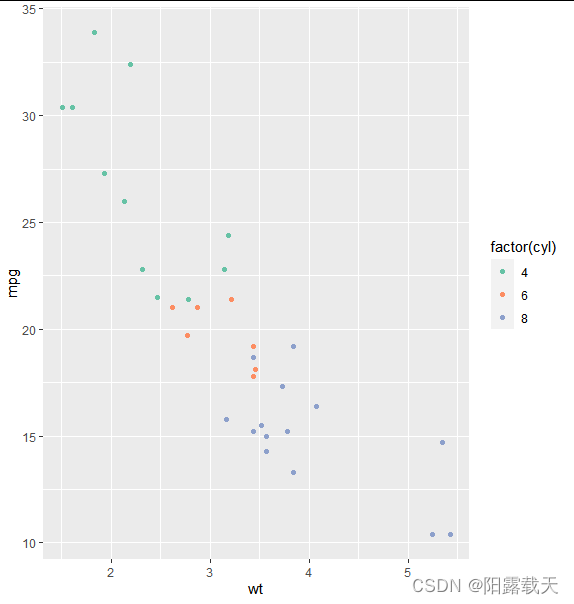
geom_abline(intercept = 0, slope = 1, colour = "red")>mtcars %>% ggplot( aes(wt, mpg) ) + geom_point( aes( color = factor(cyl) ) ) +
+ scale_color_brewer( palette = "Set2" )使用自带的set:
(2) scale_colour_manual()
可以设置关注数据的颜色,以break来呈现对数据的不同levels的划分。
> mtcars %>% ggplot( aes(wt, gear) ) + geom_point( aes( color = factor(gear) ) ) +
    scale_color_manual( breaks = c("3","4"), values = c("pink","yellow","blue","green") )
(3) scale_colour_gradient()
scale_colour_gradient(
...,
low = 颜色渐变区间,
high = 颜色渐变区间,
space = "Lab",
na.value = na值对应颜色,
guide = "colourbar",
aesthetics = "colour"
)
或是直接在里面输入参数 color = c(颜色1,颜色2,颜色3...)以达到不同颜色连续渐变的效果。
4. 绘图分面(facet)
下面介绍介绍几个能够控制facet的函数
(1) 使用cowplot包的plot_grid() 函数
plot_grid(plot1,plot2,plot3,ncol = 2,labels = c('A','B','C','D'))给plot1~4这四个图片汇总在一起,以两列的矩阵的形式,同时分别冠上标签ABCD
(2) 使用patchwork包的plot_layout()函数
可以向函数内部输送“简易”的排布顺序,下图所示的以plot1位于最上,plot2~3分居其下左右的一个分布:
plot_layout(plot1 / (plot2 | plot3))或是直接输入分布矩阵(layout matrix),详细见官网:https://patchwork.data-imaginist.com


