Python ·信用卡欺诈检测【Catboost】
Python ·信用卡欺诈检测【Catboost】
提示:前言
Python ·信用卡欺诈检测
提示:写完文章后,目录可以自动生成,如何生成可参考右边的帮助文档
文章目录
- Python ·信用卡欺诈检测【Catboost】
- 前言
- 一、导入包
- 二、加载数据
- 三、数据可视化
- 四、 相关性
- 五、 数据标准化
- 六、CatBoost
- 七、对 X_test 的预测
前言
提示:以下是本篇文章正文内容,下面案例可供参考
一、导入包
import pandas as pd
import numpy as np
import seaborn as sns
import matplotlib.pyplot as plt
import matplotlib.gridspec as grid_spec
import plotly.graph_objects as go
from plotly.subplots import make_subplots
from sklearn.preprocessing import LabelEncoder
from sklearn import preprocessing
from sklearn.preprocessing import RobustScaler
from sklearn.model_selection import train_test_split, StratifiedKFold
from catboost import CatBoostClassifier
from sklearn.metrics import roc_auc_score

import warnings
warnings.filterwarnings('ignore')
二、加载数据
阅读此链接上可用的原始数据集(作为数据框)
https://www.kaggle.com/datasets/mlg-ulb/creditcardfraud.
df_train = pd.read_csv("/kaggle/input/playground-series-s3e4/train.csv")
df_test = pd.read_csv("/kaggle/input/playground-series-s3e4/test.csv")
df_subm = pd.read_csv("/kaggle/input/playground-series-s3e4/sample_submission.csv")
df_org = pd.read_csv("/kaggle/input/creditcardfraud/creditcard.csv")
Color Palette
#Custom Color Palette
custom_colors = ["#0084B3","#3386FF","#aab94c","#dbc12f","#EFB000"]
customPalette = sns.set_palette(sns.color_palette(custom_colors))
sns.palplot(sns.color_palette(custom_colors),size=1.2)
plt.tick_params(axis='both', labelsize=0, length = 0)
df_train.head()
org_float = df_org.select_dtypes(np.float).columns
org_int = df_org.select_dtypes(np.int).columns

test_float = df_test.select_dtypes(np.float).columns
test_int = df_test.select_dtypes(np.int).columns

train_float = df_train.select_dtypes(np.float).columns
train_int = df_train.select_dtypes(np.int).columns

labels1=['Float', 'Integer']
values1= [len(train_float), len(train_int)]
labels2=['Float', 'Integer']
values2= [len(test_float), len(test_int)]
labels3=['Float', 'Integer']
values3= [len(org_float), len(org_int)]

fig, ax = plt.subplots(1,3, figsize = (18,18))
((ax1, ax2,ax3)) = ax

ax1.pie(x=values1, labels=labels1, autopct="%1.1f%%",colors=["#EFB000","#3386FF"],shadow=True,
        startangle=45, explode=[0.06, 0.07])
ax1.set_title("Train Features", fontdict={'fontsize': 14},fontweight ='bold',color="#3a0ca3")

ax2.pie(x=values2, labels=labels2, autopct="%1.1f%%",colors=["#EFB000","#3386FF"],shadow=True,
        startangle=45, explode=[0.06, 0.07])
ax2.set_title("Test Features", fontdict={'fontsize': 14},fontweight ='bold',color="#3a0ca3")

ax3.pie(x=values3, labels=labels3, autopct="%1.1f%%",colors=["#EFB000","#3386FF"],shadow=True,
        startangle=45, explode=[0.06, 0.07])
ax3.set_title("Original Features", fontdict={'fontsize': 14},fontweight ='bold',color="#3a0ca3")
class_train_labels = ["0","1"]
class_train_values = df_train['Class'].value_counts().tolist()

class_org_labels = ["0","1"]
class_org_values = df_org['Class'].value_counts().tolist()

fig, ax = plt.subplots(1,2, figsize = (12,12))
((ax1, ax2)) = ax

ax1.pie(x=class_train_values, labels=class_train_labels, autopct="%1.1f%%",shadow=True,
        startangle=45, explode=[0.1, 0.1],colors=["#EFB000","#3386FF"])
ax1.set_title("Train", fontdict={'fontsize': 14},fontweight ='bold',color="#3a0ca3")

ax2.pie(x=class_org_values, labels=class_org_labels, autopct="%1.1f%%",shadow=True,
        startangle=45, explode=[0.1, 0.1],colors=["#EFB000","#3386FF"])
ax2.set_title("Original", fontdict={'fontsize': 14},fontweight ='bold',color="#3a0ca3")
三、数据可视化
存储用于缩放各个值的数字列
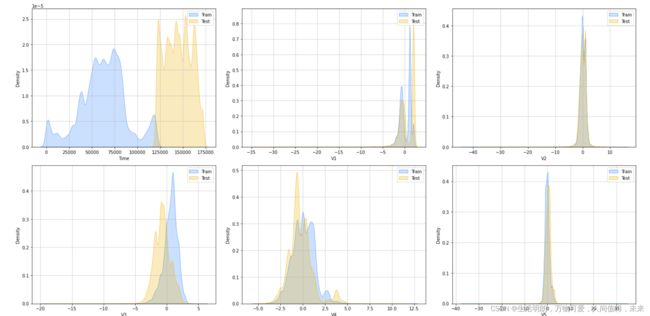
fig = plt.figure(figsize=(20, 50))
rows, cols = 10, 3
for idx, num in enumerate(train_float[:30]):
    ax = fig.add_subplot(rows, cols, idx+1)
    ax.grid(alpha = 0.7, axis ="both")
    sns.kdeplot(x = num, fill = True,color ="#3386FF",linewidth=0.6, data = df_train, label = "Train")
    sns.kdeplot(x = num, fill = True,color ="#EFB000",linewidth=0.6, data = df_test, label = "Test")
    ax.set_xlabel(num)
    ax.legend()
fig.tight_layout()
fig.show()
corr_feat = df_train.corr()
plt.figure(figsize=(24,8))
corr_feat["Class"][:-1].plot(kind="bar",grid=False,color=["#3386FF","#EFB000"])
plt.title("Features correlation")
四、 相关性
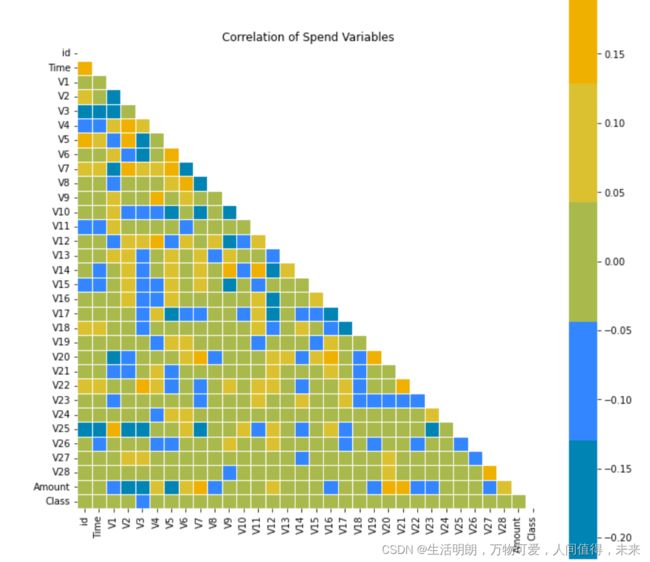
plt.figure(figsize = (11,11))
corr = df_train.corr()
mask = np.triu(np.ones_like(corr, dtype=bool))
sns.heatmap(corr, mask = mask, robust = True, center = 0,square = True, cmap=custom_colors,linewidths = .6)
plt.title('Correlation of Spend Variables')
plt.show()
五、 数据标准化
rscale = RobustScaler()

df_train['Amount']=rscale.fit_transform(df_train['Amount'].values.reshape(-1,1))
df_train['Time']=rscale.fit_transform(df_train['Time'].values.reshape(-1,1))

df_test['Amount']=rscale.fit_transform(df_test['Amount'].values.reshape(-1,1))
df_test['Time']=rscale.fit_transform(df_test['Time'].values.reshape(-1,1))

df_org['Amount']=rscale.fit_transform(df_org['Amount'].values.reshape(-1,1))
df_org['Time']=rscale.fit_transform(df_org['Time'].values.reshape(-1,1))

df  = pd.concat([df_train, df_org]).reset_index(drop = True)
df.reset_index(inplace = True, drop = True)

feats = list(df_train.columns)
feats.remove('Class')
target = 'Class'
catboost_params = {'n_estimators': 500,'learning_rate': 0.05, 'one_hot_max_size': 12,
               'depth': 4,'l2_leaf_reg': 0.025,'colsample_bylevel': 0.06,
               'min_data_in_leaf': 12}
SPLITS = 10
RANDOM = 42
VERBOSE = 0
clfs = []
scores = []
y_pred = []
六、CatBoost
kfold = StratifiedKFold(n_splits = SPLITS, shuffle = True, random_state = RANDOM)

for train_index, test_index in kfold.split(df, y = df['Class']):
    x_train, x_test = df[feats].loc[train_index], df[feats].loc[test_index]
    y_train, y_test = df[target][train_index], df[target][test_index]
    clf = CatBoostClassifier(**catboost_params)
    clf.fit(x_train.values, y_train, eval_set = [(x_test, y_test)], verbose=VERBOSE)
    preds = clf.predict_proba(x_test.values)
    clfs.append(clf)
    scores.append(roc_auc_score(y_test, preds[:, 1]))
print(f'score: {np.mean(scores)}')
score: 0.9267883834351132
七、对 X_test 的预测
for clf in clfs:
    preds = clf.predict_proba(df_test[feats].values)
    y_pred.append(preds[:, 1])
以要求的格式转换 DataFrame 以提交给比赛
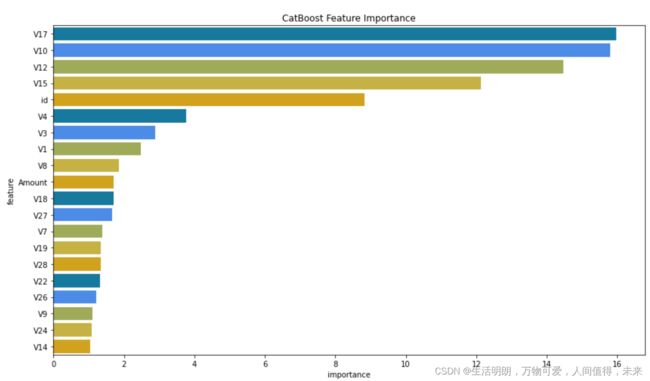
df_imp = pd.DataFrame({'feature': x_train.columns, 'importance': clf.feature_importances_})
plt.figure(figsize = (12,7))
sns.barplot(x="importance", y="feature",
            data = df_imp.sort_values(by ="importance", ascending = False).iloc[:20],palette = custom_colors)
plt.title("CatBoost Feature Importance")
plt.tight_layout()
plt.show()
y_pred = np.stack(y_pred).mean(0)
y_pred
df_subm = pd.DataFrame(data={'id': df_test.id, 'Class': y_pred})
df_subm


