scipy.interpolate插值
python SciPy库依赖于NumPy,提供了便捷且快速的N维数组操作。
可以实现插值,积分,优化,图像处理,特殊函数等等操作。
参考官方文档:
Interpolation (scipy.interpolate) — SciPy v1.7.1 Manual![]() https://docs.scipy.org/doc/scipy/reference/tutorial/interpolate.htmlscipy.interpolate中的interp1d类是一种基于固定数据点创建函数的方便方法,可以使用线性插值在给定数据定义的域内的任何位置对其进行计算。该类的实例是通过传递包含数据的一维向量来创建的。这个类的实例定义了一个_调用_方法,因此可以像函数一样处理,在已知数据值之间插值以获得未知值。可以在实例化时指定边界处的行为。
https://docs.scipy.org/doc/scipy/reference/tutorial/interpolate.htmlscipy.interpolate中的interp1d类是一种基于固定数据点创建函数的方便方法,可以使用线性插值在给定数据定义的域内的任何位置对其进行计算。该类的实例是通过传递包含数据的一维向量来创建的。这个类的实例定义了一个_调用_方法,因此可以像函数一样处理,在已知数据值之间插值以获得未知值。可以在实例化时指定边界处的行为。
以下示例演示了其在线性和三次样条插值中的使用:
from scipy.interpolate import interp1d
x = np.linspace(0, 10, num=11, endpoint=True)
y = np.cos(-x**2/9.0)
f = interp1d(x, y)
f2 = interp1d(x, y, kind='cubic')
xnew = np.linspace(0, 10, num=41, endpoint=True)
import matplotlib.pyplot as plt
plt.plot(x, y, 'o', xnew, f(xnew), '-', xnew, f2(xnew), '--')
plt.legend(['data', 'linear', 'cubic'], loc='best')
plt.show()
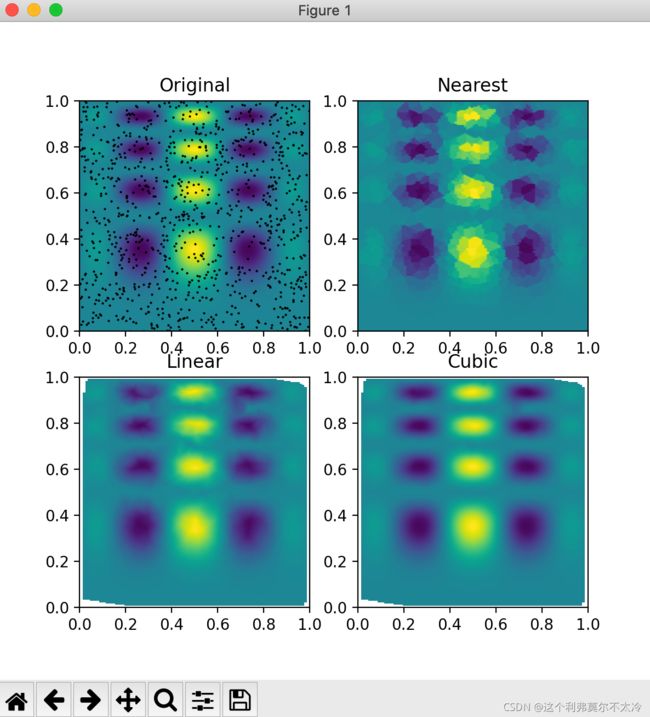
假设我们有多维数据,例如,对于底层函数f(x,y),我们只知道不形成规则网格的点(x[i],y[i])处的值。假设我们要插值二维函数,这就像是聚类算法一样。
def func(x, y):
     return x*(1-x)*np.cos(4*np.pi*x) * np.sin(4*np.pi*y**2)**2
# np.mgrid的用法
# 功能:返回多维结构,常见的如2D图形,3D图形
# np.mgrid[ 第1维,第2维 ,第3维 , …]
grid_x, grid_y = np.mgrid[0:1:100j, 0:1:200j]
rng = np.random.default_rng()
points = rng.random((1000, 2))
values = func(points[:,0], points[:,1])
from scipy.interpolate import griddata
grid_z0 = griddata(points, values, (grid_x, grid_y), method='nearest')
grid_z1 = griddata(points, values, (grid_x, grid_y), method='linear')
grid_z2 = griddata(points, values, (grid_x, grid_y), method='cubic')
import matplotlib.pyplot as plt
plt.subplot(221)
plt.imshow(func(grid_x, grid_y).T, extent=(0,1,0,1), origin='lower')
plt.plot(points[:,0], points[:,1], 'k.', ms=1)
plt.title('Original')
plt.subplot(222)
plt.imshow(grid_z0.T, extent=(0,1,0,1), origin='lower')
plt.title('Nearest')
plt.subplot(223)
plt.imshow(grid_z1.T, extent=(0,1,0,1), origin='lower')
plt.title('Linear')
plt.subplot(224)
plt.imshow(grid_z2.T, extent=(0,1,0,1), origin='lower')
plt.title('Cubic')
plt.gcf().set_size_inches(6, 6)
plt.show()
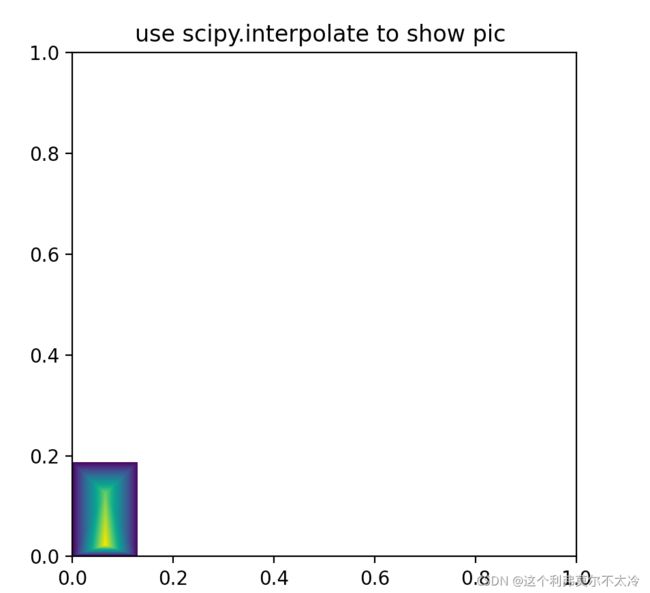
接下来我们通过一张图得到它的长宽,然后我们定义points,values两组矩阵,分别表示坐标点的坐标信息,以及对应的像素点权重。最后来生成一张权重插值图
import cv2
import numpy as np
from scipy.interpolate import griddata
from scipy.interpolate import griddata
import matplotlib.pyplot as plt


def create_priority(width, height, points, values):
    # points = np.array([[0,0],[128,30],[255,0],[128, 170], [0,255],[255,0],[255,255]])
    # values = np.array([0, 255, 0, 200, 0, 0, 0])
    grid_x, grid_y = np.mgrid[0:width, 0:height]
    points = np.array(points)
    values = np.array(values)
    grid_z1 = griddata(points, values, (grid_x, grid_y), method='linear')
    # 如果是subplot (2 ,2 ,1),那么这个figure就是个2*2的矩阵图,也就是总共有4个图,1就代表了第一幅图
    plt.subplot(111)
    plt.imshow(grid_z1.T, extent=(0, 1, 0, 1), origin='lower')
    plt.title('use scipy.interpolate to show pic ')
    # cv2.imwrite('./0_weight.jpg', grid_z1.T)
    plt.show()
    mask = grid_z1.T.astype(np.uint8)
    cv2.imwrite('./0_weight.jpg', mask)
    print(mask)
    return mask


if __name__ == '__main__':
    img_path = './0.jpg'
    img = cv2.imread(img_path)
    width, height, _ = img.shape
    points = np.array([[0,0],[128,30],[255,0],[128, 170], [0,255],[255,0],[255,255]])
    values = np.array([0, 255, 0, 200, 0, 0, 0])
    create_priority(width, height, points, values)

