《统计学习方法》-李航、《机器学习-西瓜书》-周志华总结+Python代码连载(二)--线性模型(Linear model)
一、线性回归(Linear regression)
线性回归试图学得一个线性模型以尽可能准确地预测实值输出标记,用公式表达为:![]() ,使得
,使得![]() 。那么怎么求得w,b呢?基本使用最小二乘法和梯度下降。
。那么怎么求得w,b呢?基本使用最小二乘法和梯度下降。
- 最小二乘法:最小化均方差函数(本连载一中有相关解释)。
- 梯度下降:是一种迭代算法。选取适当的初值,不断迭代,更新参数值,进行目标函数的极小化,直到收敛。由于负梯度方向是使函数值下降最快的方向,在迭代的每一步,以负梯度方向更新参数的值。
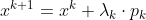
梯度下降算法:
输入:目标函数f(x),梯度函数g(x) = ![]() ,计算精度
,计算精度 。
。
输出:f(x)的极小点 。
。
- 去初始值
 ,置k=0.
 - 计算
 .
. - 计算梯度
 ,当
,当 时,停止迭代,令=
 ;否则,令
;否则,令 ,求
,求 ,使
,使 .
. - 置
 ,计算
,计算 ,当
,当 或
或 ,停止迭代,令
- 否则 k = k+1 转3.
代码实现:
import numpy as np
import pandas as pd
import matplotlib.pyplot as plt
from sklearn.datasets import make_regression

get_ipython().run_line_magic('matplotlib', 'inline')

x_train,y_train = make_regression(n_samples=100,noise=20,n_features=1)
plt.scatter(x_train,y_train)

#使用梯度下降来求解
class LinearRegression():
    def __init__(self):
        pass
    def fit(self,x,y,lr):
        x = np.insert(x,0,1,axis=1)
        y = y.reshape(-1,1)
        self.w = np.random.randn(x.shape[1],1)
        self.lr = lr

        for _ in range(50):
            y_pred = x @ self.w
            mse = np.mean(0.5*(y_pred-y)**2)
            grad_w = x.T@(y_pred-y)
            self.w -= self.lr*grad_w
            print(_,mse,self.w[0][0],self.w[1][0])
    def predict(self,x):
        x = np.insert(x,0,1,axis=1)
        return x @ self.w

LR = LinearRegression()

LR.fit(x_train,y_train,0.01)

y_pred = LR.predict(x_train)
plt.scatter(x_train,y_train)
plt.plot(x_train,y_pred,'r--')
二、对数线性回归(log-linear regression)
将线性模型:![]() ,实际上是试图让
,实际上是试图让![]() 逼近y,在形式上虽是线性回归,但实际上已是在求取输入空间到输出空间的非线性函数映射 。
逼近y,在形式上虽是线性回归,但实际上已是在求取输入空间到输出空间的非线性函数映射 。
三、对数几率回归/逻辑斯蒂回归(logistic regression)
3.1 二元逻辑回归
将线性回归预测实值转成0/1,可考虑在线性回归后加上一个单位阶跃函数。单位阶跃函数不连续,可以找到sigmod函数/对数几率函数:![]() ,于是可以得到
,于是可以得到![]() ,得到几率:
,得到几率:![]() ,进一步得到
,进一步得到![]() 即亦称对数几率。我们将y视为类后验概率估计p(y=1|x),则显然有:
即亦称对数几率。我们将y视为类后验概率估计p(y=1|x),则显然有:
![]() ,
,![]()
我们可以通过极大似然函数来估计w,b。不妨设p=p(y=1|x),则1-p = p(y=0|x)。似然函数: ,对似然函数取对数后:
![\l (w,b) = \sum_{i=1}^{N}[y_{i}\cdot log(p(x_{i}))+(1-y_{i})log(1-p(x_{i}))]](http://img.e-com-net.com/image/info8/7fda175bf1654fe8a18cfdd0a1e3d3d0.gif) ,可以对对数似然函数添加负号,已达到最小化函数,采用梯度下降求解w,b。
,可以对对数似然函数添加负号,已达到最小化函数,采用梯度下降求解w,b。
3.2 多元逻辑回归
假设Y的取值集合为{1,2,...,K},则有:
 k = 1,2,...,k-1
代码实现:
import numpy as np
from sklearn.datasets import load_iris,make_classification
import matplotlib.pyplot as plt

sigmoid = lambda x:1./(1+np.exp(-x))

x = np.linspace(-10,10,10000)
y = sigmoid(x)
plt.plot(x,y)
plt.scatter(0,sigmoid(0))
data = load_iris()
x_trian = data.data[data.target != 0]
y_trian = data.target[data.target !=0]
y_trian[y_trian==1] = 0
y_trian[y_trian==2] = 1
y_trian = y_trian.reshape(-1,1)
x_trian[:5],y_trian[:5]

#定义对数回归的梯度下架解法
class LogisticRegression_1():
    def __init__(self):
        self.sigmoid = lambda x:1./(1+np.exp(-x))
    def fit(self,x,y,lr):
        self.w = np.random.randn(x.shape[1],1)
        self.lr = lr
        for _ in range(1000):
            y_pred = self.sigmoid(x @ self.w)
            self.w -=self.lr * x.T @ (y_pred-y)
            print(np.mean(0.5*(y_pred-y)**2))
    def predict(self,x):
        y_pred = np.round(self.sigmoid(x @ self.w))
        return y_pred

LR = LogisticRegression_1()
LR.fit(x_trian,y_trian,0.01)

y_pred = LR.predict(x_trian)
acc = np.sum(y_trian==y_pred,axis=0)/len(y_trian)
acc[0]


# 下面是较为复杂的一种实现


from math import exp
import numpy as np
import pandas as pd
import matplotlib.pyplot as plt
get_ipython().run_line_magic('matplotlib', 'inline')

from sklearn.datasets import load_iris
from sklearn.model_selection import train_test_split

# data
def create_data():
    iris = load_iris()
    df = pd.DataFrame(iris.data, columns=iris.feature_names)
    df['label'] = iris.target
    df.columns = ['sepal length', 'sepal width', 'petal length', 'petal width', 'label']
    data = np.array(df.iloc[:100, [0,1,-1]])
    # print(data)
    return data[:,:2], data[:,-1]

X, y = create_data()
X_train, X_test, y_train, y_test = train_test_split(X, y, test_size=0.3)

class LogisticReressionClassifier:
    def __init__(self, max_iter=200, learning_rate=0.01):
        self.max_iter = max_iter
        self.learning_rate = learning_rate

    def sigmoid(self, x):
        return 1 / (1 + exp(-x))

    def data_matrix(self, X):
        data_mat = []
        for d in X:
            data_mat.append([1.0, *d])
        return data_mat

    def fit(self, X, y):
        # label = np.mat(y)
        data_mat = self.data_matrix(X)  # m*n
        self.weights = np.zeros((len(data_mat[0]), 1), dtype=np.float32)

        for iter_ in range(self.max_iter):
            for i in range(len(X)):
                result = self.sigmoid(np.dot(data_mat[i], self.weights))
                error = y[i] - result
                self.weights += self.learning_rate * error * np.transpose(
                    [data_mat[i]])
        print('LogisticRegression Model(learning_rate={},max_iter={})'.format(
            self.learning_rate, self.max_iter))

    # def f(self, x):
    #     return -(self.weights[0] + self.weights[1] * x) / self.weights[2]

    def score(self, X_test, y_test):
        right = 0
        X_test = self.data_matrix(X_test)
        for x, y in zip(X_test, y_test):
            result = np.dot(x, self.weights)
            if (result > 0 and y == 1) or (result < 0 and y == 0):
                right += 1
        return right / len(X_test)

lr_clf = LogisticReressionClassifier()
lr_clf.fit(X_train, y_train)
lr_clf.score(X_test, y_test)

x_ponits = np.arange(4, 8)
y_ = -(lr_clf.weights[1]*x_ponits + lr_clf.weights[0])/lr_clf.weights[2]
plt.plot(x_ponits, y_)

#lr_clf.show_graph()
plt.scatter(X[:50,0],X[:50,1], label='0')
plt.scatter(X[50:,0],X[50:,1], label='1')
plt.legend()


# scikit-learn实例
# sklearn.linear_model.LogisticRegression
# solver参数决定了我们对逻辑回归损失函数的优化方法,有四种算法可以选择,分别是:
#
# a) liblinear:使用了开源的liblinear库实现,内部使用了坐标轴下降法来迭代优化损失函数。
# b) lbfgs:拟牛顿法的一种,利用损失函数二阶导数矩阵即海森矩阵来迭代优化损失函数。
# c) newton-cg:也是牛顿法家族的一种,利用损失函数二阶导数矩阵即海森矩阵来迭代优化损失函数。
# d) sag:即随机平均梯度下降,是梯度下降法的变种,和普通梯度下降法的区别是每次迭代仅仅用一部分的样本来计算梯度,适合于样本数据多的时候。

from sklearn.linear_model import LogisticRegression
clf = LogisticRegression(max_iter=200)


clf.fit(X_train, y_train)

print(clf.coef_, clf.intercept_)


x_ponits = np.arange(4, 8)
y_ = -(clf.coef_[0][0]*x_ponits + clf.intercept_)/clf.coef_[0][1]
plt.plot(x_ponits, y_)

plt.plot(X[:50, 0], X[:50, 1], 'bo', color='blue', label='0')
plt.plot(X[50:, 0], X[50:, 1], 'bo', color='orange', label='1')
plt.xlabel('sepal length')
plt.ylabel('sepal width')
plt.legend()![]()
四、线性判别分析(Linear Discriminant Analysis)
LDA基本思想:给定训练集,设法将样例投影到一条直线使得同样样例的投影尽可能接近,异类样例的投影点尽可能远离;在对新样本进行分类时,将其投影到同样的这条直线上,再根据投影点的位置来确定新样本的类别。
令![]() 分别为第i类示例的集合、均值向量、协方差矩阵(每个元素是各个向量元素之间的协方差)。若将数据投影到直线
分别为第i类示例的集合、均值向量、协方差矩阵(每个元素是各个向量元素之间的协方差)。若将数据投影到直线 上,则有两类样本的中心在直线上的投影分别为
![]() ,同样可得到两类样本的协方差为
,同样可得到两类样本的协方差为![]() 。欲使同样样例的投影点尽可能接近,让投影点的协方差尽可能小,即
。欲使同样样例的投影点尽可能接近,让投影点的协方差尽可能小,即![]() 尽可能小;欲使异类样例的投影点尽可能远离,可以让类中心之间的距离尽可能大,即
尽可能小;欲使异类样例的投影点尽可能远离,可以让类中心之间的距离尽可能大,即![]() 尽可能大,同时考虑两者得到最大化目标
尽可能大,同时考虑两者得到最大化目标![]() 。定义类内散度矩阵
。定义类内散度矩阵![]() ,定义类间散度矩阵
,定义类间散度矩阵![]() ,于是LDA最大化目标为:
,于是LDA最大化目标为:![]() 。
。
代码实现:
# 将样例投影到一条直线上,使得同类的样例投影点尽可能小,不同类投影点尽可能远离

import os
import sys
import numpy as np
import operator
import matplotlib.pyplot as plt

group1 = np.random.random((8,2))*5+20
group2 = np.random.random((8,2))*5+2


x1 = group1
y1 = np.ones((8,1))
x0 = group2
y0 = np.zeros((8,1))


plt.scatter(x1[:,0],x1[:,1],c = 'r')
plt.scatter(x0[:,0],x0[:,1],c = 'g')

mean1 = np.array([np.mean(x1[:,0]),np.mean(x1[:,1])])
mean0 = np.array([np.mean(x0[:,0]),np.mean(x0[:,1])])
from numpy import mat
m1 = np.shape(x1)[0]
sw = np.zeros(shape=(2,2))
for i in range(m1):
    xsmean = mat(x1[i,:]-mean1)
    sw+=xsmean.transpose()*xsmean
m0 = np.shape(x0)[0]
for i in range(m0):
    xsmean = mat(x0[i,:]-mean0)
    sw+=xsmean.transpose()*xsmean
w = (mean0-mean1)*(mat(sw).I)

plt.scatter(x1[:,0],x1[:,1],c = 'r')
plt.scatter(x0[:,0],x0[:,1],c = 'g')
x = np.arange(0,25,0.1)
y = np.array((-w[0,0]*x)/w[0,1])
plt.plot(x,y)
连载GitHub同步更新:https://github.com/wenhan123/ML-Python-