(实践)单层感知器——异或问题&线性神经网络,Delta学习规则&线性神经网络解决异或问题
'''
异或
0^0 = 0
0^1 = 1
1^0 = 1
1^1 = 0
'''
import numpy as np
import matplotlib.pyplot as plt
#输入数据
X = np.array([[1,0,0],
              [1,0,1],
              [1,1,0],
              [1,1,1]])
#标签
Y = np.array([[-1],
              [1],
              [1],
              [-1]])

#权值初始化,3行1列,取值范围-1到1
W = (np.random.random([3,1])-0.5)*2

print(W)
#学习率设置
lr = 0.11
#神经网络输出
O = 0

def update():
    global X,Y,W,lr
    O = np.sign(np.dot(X,W)) # shape:(3,1)
    W_C = lr*(X.T.dot(Y-O))/int(X.shape[0])
    W = W + W_C
for i in range(100):
    update()#更新权值
    print(W)#打印当前权值
    print(i)#打印迭代次数
    O = np.sign(np.dot(X,W))#计算当前输出
    if(O == Y).all(): #如果实际输出等于期望输出,模型收敛,循环结束
        print('Finished')
        print('epoch:',i)
        break

#正样本
x1 = [0,1]
y1 = [1,0]
#负样本
x2 = [0,1]
y2 = [0,1]

#计算分界线的斜率以及截距
k = -W[1]/W[2]
d = -W[0]/W[2]
print('k=',k)
print('d=',d)

xdata = (-2,3)

plt.figure()
plt.plot(xdata,xdata*k+d,'r')
plt.scatter(x1,y1,c='b')
plt.scatter(x2,y2,c='y')
plt.show()

#最后的结果我们发现它是执行了100次才跳出循环,说明无法用一条直线来进行非线性分类问题
import numpy as np
import matplotlib.pyplot as plt
#输入数据
X = np.array([[1,3,3],
              [1,4,3],
              [1,1,1],
              [1,0,2]])
#标签
Y = np.array([[1],
              [1],
              [-1],
              [-1]])

#权值初始化,3行1列,取值范围-1到1
W = (np.random.random([3,1])-0.5)*2

print(W)
#学习率设置
lr = 0.11
#神经网络输出
O = 0

def update():
    global X,Y,W,lr
    O = np.dot(X,W)  #因为线性用得函数是y=x所以这里可以直接写,而不是引用激活函数
    W_C = lr*(X.T.dot(Y-O))/int(X.shape[0])
    W = W + W_C
for _ in range(100):
    update()#更新权值

    #正样本
    x1 = [3,4]
    y1 = [3,3]
    #负样本
    x2 = [1,0]
    y2 = [1,2]

    #计算分界线的斜率以及截距
    k = -W[1]/W[2]
    d = -W[0]/W[2]
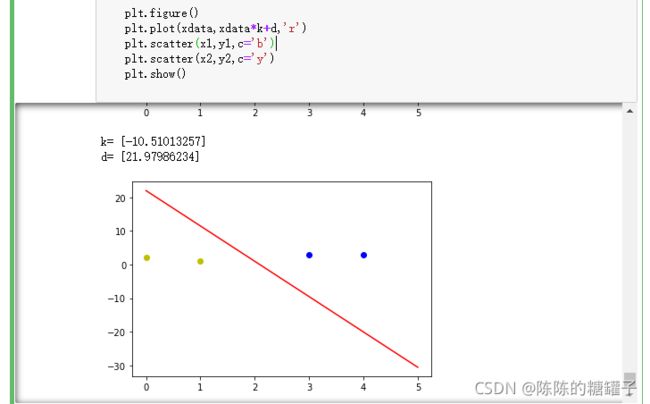
    print('k=',k)
    print('d=',d)

    xdata = (0,5)

    plt.figure()
    plt.plot(xdata,xdata*k+d,'r')
    plt.scatter(x1,y1,c='b')
    plt.scatter(x2,y2,c='y')
    plt.show()
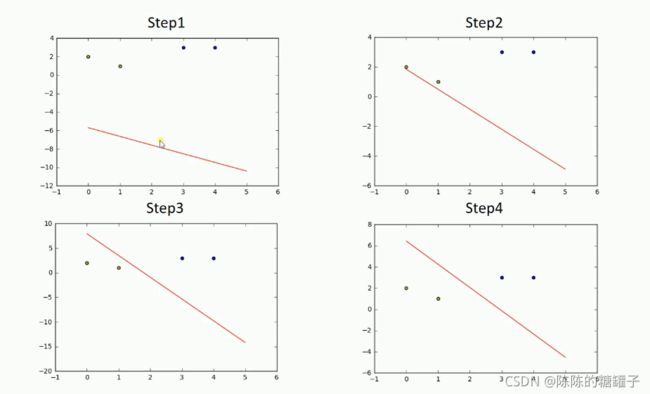
过程
Delta学习规则

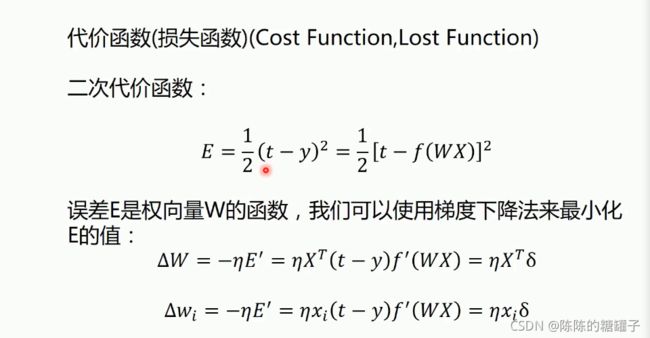
梯度下降法——一维情况

梯度下降法——二维情况


解决异或问题

import numpy as np
import matplotlib.pyplot as plt
#输入数据
X = np.array([[1,0,0,0,0,0],
              [1,0,1,0,0,1],
              [1,1,0,1,0,0],
              [1,1,1,1,1,1]])
#标签
Y = np.array([-1,1,1,-1])

#权值初始化,3行1列,取值范围-1到1
W = (np.random.random(6)-0.5)*2

print(W)
#学习率设置
lr = 0.11
#计算迭代次数
n = 0
#神经网络输出
O = 0

def update():
    global X,Y,W,lr,n
    n+=1
    O = np.dot(X,W.T)  #因为线性用得函数是y=x所以这里可以直接写,而不是引用函数
    W_C = lr*((Y-O.T).dot(X))/int(X.shape[0])
    W = W + W_C
for _ in range(1000):
    update()#更新权值
#     print(W)#打印当前权值
#     print(n)#打印当前迭代次数

    # -0.1,0.1,0.2,-0.2
    #-1,1,1,-1
#     o = np.sign(np.dot(X,W.T))#计算当前输出
#     if(O == Y.T).all(): #如果实际输出等于期望输出,模型收敛,循环结束
#         print('Finished')
#         print('epoch:',n)
#         break

#正样本
x1 = [0,1]
y1 = [1,0]
#负样本
x2 = [0,1]
y2 = [0,1]

    #计算分界线的斜率以及截距
#     k = -W[1]/W[2]
#     d = -W[0]/W[2]
#     print('k=',k)
#     print('d=',d)

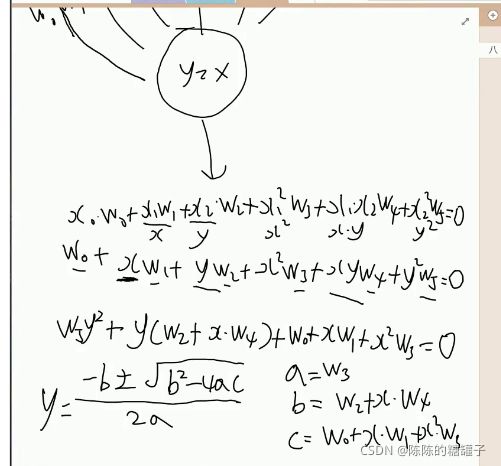
def calculate(x,root):
    a = W[5]
    b = W[2]+x*W[4]
    c = W[0]+x*W[1]+x**2*W[3]
    if root==1:
        return (-b+np.sqrt(b*b-4*a*c))/(2*a)
    if root==2:
        return (-b-np.sqrt(b*b-4*a*c))/(2*a)


xdata = np.linspace(-1,2)

plt.figure()

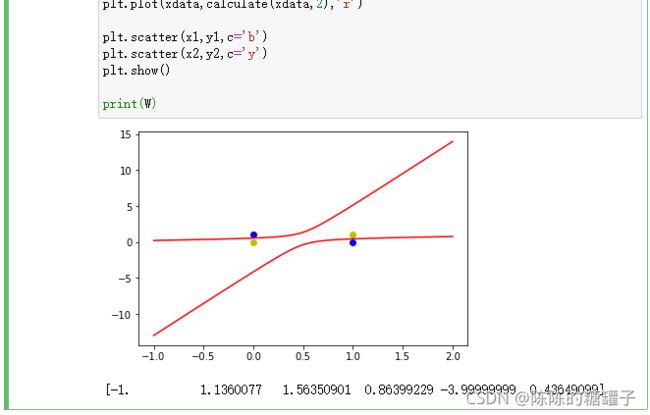
plt.plot(xdata,calculate(xdata,1),'r')
plt.plot(xdata,calculate(xdata,2),'r')

plt.scatter(x1,y1,c='b')
plt.scatter(x2,y2,c='y')
plt.show()

print(W)
o = np.dot(X,W.T)
print(o)


