K-Means聚类算法及其python实现(已附上代码至本博客)
目录
- 一、算法公式讲解
- 二、算法流程
- 三、算法实现代码
- 四、代码结果分析
- 五、K-Means库函数
一、算法公式讲解
对于
n代表了x有n维,x上标j表示第j维的特征,下标i表示该向量是第i个样本

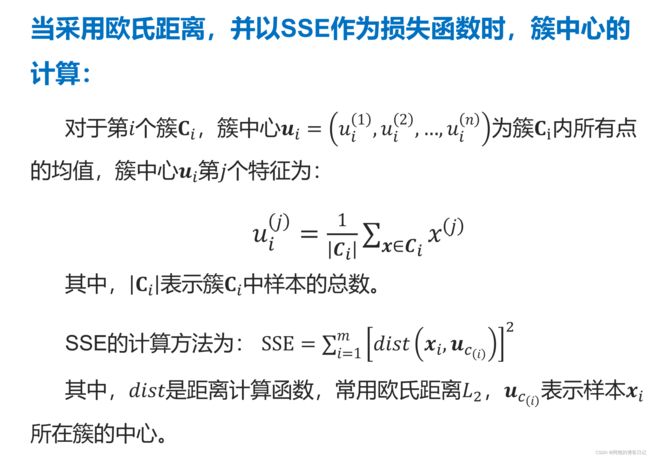
簇中心坐标为:(当然,这也是重新计算簇中心坐标的方法!!)
向量 u i = ( u i ( 1 ) , u i ( 2 ) , ⋅ ⋅ ⋅ , u i ( j ) , ⋅ ⋅ ⋅ , u i ( n ) ) u_i=(u_i^{(1)} ,u_i^{(2)}, ···, u_i^{(j)},···,u_i^{(n)}) ui=(ui(1),ui(2),⋅⋅⋅,ui(j),⋅⋅⋅,ui(n)),然后标量

其中一个维度,这里比如说是第2个样本的第1维特征 u 2 1 u_{2}^{1} u21,我就到这个第二个簇里面把这个簇所有点第一特征求和得到sum,然后把总和sum除以这个簇的大小| C 2 C_2{} C2|(这个簇里面点的个数),然后就得到第2簇的簇中心的第1维的特征(坐标)
比如第一簇的簇中心坐标: u 1 = ( u 1 ( 1 ) , u 1 ( 2 ) , u 1 ( 3 ) ) u_1=(u_1^{(1)} ,u_1^{(2)},u_1^{(3)}) u1=(u1(1),u1(2),u1(3))
属于第一簇的坐标有 x 2 = ( 1 , 2 , 3 ) x_2=(1 ,2,3) x2=(1,2,3), x 3 = ( 4 , 5 , 6 ) x_3=(4 ,5,6) x3=(4,5,6), x 4 = ( 7 , 8 , 9 ) x_4=(7 ,8,9) x4=(7,8,9),
则 u 1 = ( 1 + 4 + 7 3 , 2 + 5 + 8 3 , 3 + 6 + 9 3 ) = ( 4 , 5 , 6 ) u_1=(\frac{1+4+7}{3} ,\frac{2+5+8}{3},\frac{3+6+9}{3} )=(4,5,6) u1=(31+4+7,32+5+8,33+6+9)=(4,5,6)

二、算法流程

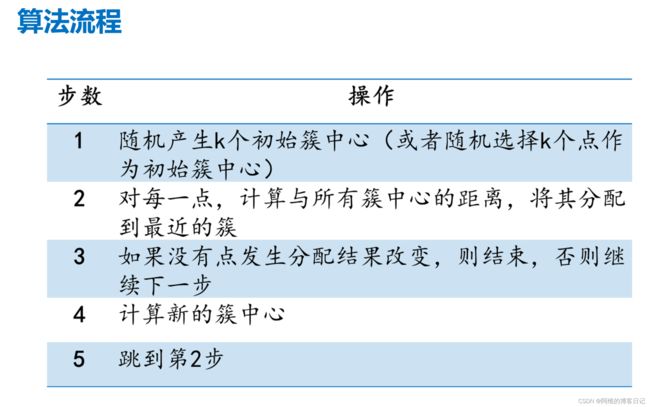
K-means算法首先随机分布簇中心,然后计算簇中心并重新分簇为一个周期进行迭代,直到簇稳定为止,
三、算法实现代码
有Kmeans.py和kmeansSamples.txt两个文件,kmeansSamples.txt记录的是所有点的坐标,Kmeans.py描述算法实现
Kmeans.py文件如下
# -*- coding: utf-8 -*-


import numpy as np
import matplotlib.pyplot as plt

def L2(vecXi, vecXj):
    '''
    计算欧氏距离
    para vecXi:点坐标,向量
    para vecXj:点坐标,向量
    retrurn: 两点之间的欧氏距离
    '''
    return np.sqrt(np.sum(np.power(vecXi - vecXj, 2)))

def kMeans(S, k, distMeas=L2):
    '''
    K均值聚类
    para S:样本集,多维数组
    para k:簇个数
    para distMeas:距离度量函数,默认为欧氏距离计算函数
    return sampleTag:一维数组,存储样本对应的簇标记
    return clusterCents:一维数组,各簇中心
    retrun SSE:误差平方和
    '''
    print('k = ' , k)
    m = np.shape(S)[0] # 样本总数
    sampleTag = np.zeros(m)
    print('sampleTag.shape=',sampleTag)
    # 随机产生k个初始簇中心
    n = np.shape(S)[1] # 样本向量的特征数
    print('n = ' , n)
    clusterCents = np.mat([[-1.93964824,2.33260803],[7.79822795,6.72621783],[10.64183154,0.20088133]])
    #clusterCents = np.mat(np.zeros((k,n)))
    #for j in range(n):
    #    minJ = min(S[:,j])
    #    rangeJ = float(max(S[:,j]) - minJ)
    #    clusterCents[:,j] = np.mat(minJ + rangeJ * np.random.rand(k,1))

    sampleTagChanged = True
    SSE = 0.0
    while sampleTagChanged: # 如果没有点发生分配结果改变,则结束
        sampleTagChanged = False
        SSE = 0.0

        # 计算每个样本点到各簇中心的距离
        # m是样本总数
        for i in range(m):
            minD = np.inf
            minIndex = -1
            # k是簇中心个数
            for j in range(k):
                # S样本集,clusterCents样本中心点
                d = distMeas(clusterCents[j,:],S[i,:])
                if d < minD:
                    minD = d
                    minIndex = j
            if sampleTag[i] != minIndex:
                sampleTagChanged = True
            sampleTag[i] = minIndex
            SSE += minD**2
        print(clusterCents)
        plt.scatter(clusterCents[:,0].tolist(),clusterCents[:,1].tolist(),c='r',marker='^',linewidths=7)
        plt.scatter(S[:,0],S[:,1],c=sampleTag,linewidths=np.power(sampleTag+0.5, 2))
        plt.show()
        print(SSE)

        # 重新计算簇中心
        for i in range(k):
            ClustI = S[np.nonzero(sampleTag[:]==i)[0]]
            clusterCents[i,:] = np.mean(ClustI, axis=0)
    return clusterCents, sampleTag, SSE

if __name__=='__main__':
    samples = np.loadtxt("kmeansSamples.txt")
    clusterCents, sampleTag, SSE = kMeans(samples, 3)
    #plt.scatter(clusterCents[:,0].tolist(),clusterCents[:,1].tolist(),c='r',marker='^')
    #plt.scatter(samples[:,0],samples[:,1],c=sampleTag,linewidths=np.power(sampleTag+0.5, 2))
    plt.show()
    print(clusterCents)
    print(SSE)
kmeansSamples.txt文件如下
8.764743691132109049e+00 1.497536962729086341e+01
4.545778445909218313e+00 7.394332431706460262e+00
5.661841772908352333e+00 1.045327224311696668e+01
6.020055532521467967e+00 1.860759073162559929e+01
1.256729723000295529e+01 5.506569916803323750e+00
4.186942275051188211e+00 1.402615035721461290e+01
5.726706075832996845e+00 8.375613974148174989e+00
4.099899279500291094e+00 1.444273323355928795e+01
2.257178930021525254e+00 1.977895587652345855e+00
4.669135451288612515e+00 7.717803834787531070e-01
8.121947597697801058e+00 7.976212807755792555e-01
7.972277764807800260e-02 -1.938666197338206221e+00
8.370047062442882435e+00 1.077781799178707622e+01
6.680973199869320922e+00 1.553118858170866545e+01
5.991946943553537963e+00 1.657732863976965021e+01
5.641990155271871643e+00 1.554671013661827672e+01
-2.925147643580102041e+00 1.108844569740028163e+01
4.996949605297930752e+00 1.986732057663068707e+00
3.866584099986317025e+00 -1.752825909916766900e+00
2.626427441224858939e+00 2.208897582166075324e+01
5.656225833870900388e+00 1.477736974879376675e+01
-3.388227926726261607e-01 5.569311423852095544e+00
1.093574481611491223e+01 1.124487205516641275e+01
4.650235760178413003e+00 1.278869502885029341e+01
8.498485127403823114e+00 9.787697108749913610e+00
7.530467091751554598e+00 8.502325665434069535e+00
6.171183705302398792e+00 2.174394049079376856e+01
-9.333949569013078040e-01 1.594142490265068712e+00
-6.377004909329702542e+00 3.463894089865578341e+00
7.135980906743346175e+00 1.417794597480970609e+01
四、代码结果分析
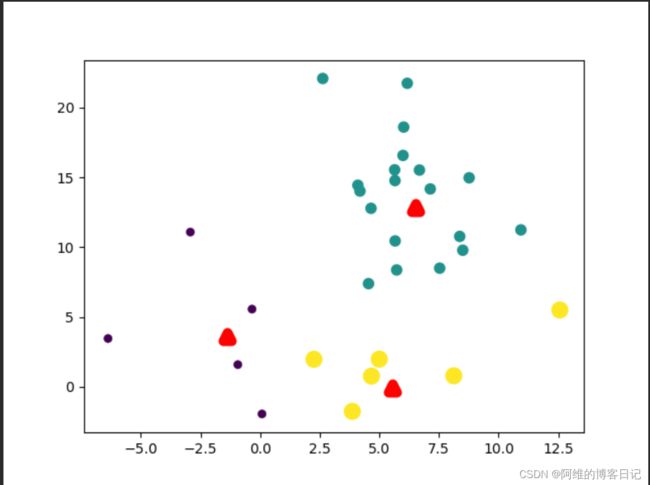
第一次迭代,簇中心分布不太合理(红色三角形代表簇中心)

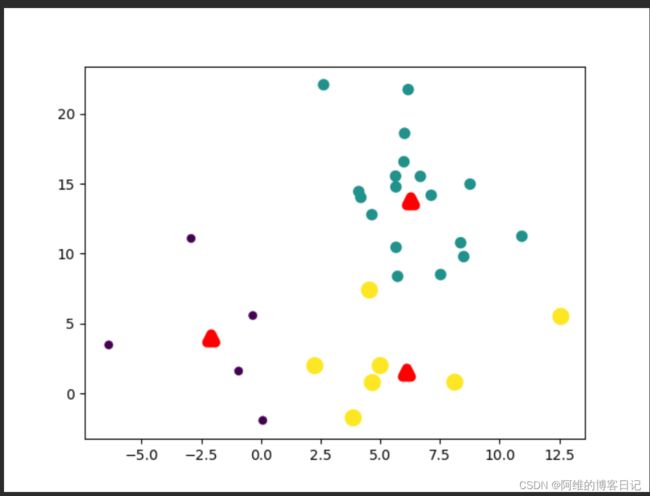
第二次迭代,簇中心重新计算,因此簇中心分布比第一次更合理

第3次迭代

第四次迭代

五、K-Means库函数
KMeans(n_clusters=8, *, init=‘k-means++’, n_init=‘k-means++’, n_init=10,max_iter=300, tol=0.0001, verbose=0, random_state=None, copy_x=True, algorithm=‘auto’)
链接:Sklearn关于K-Means的API介绍
相关输人参数和返回值,在网站上有详细介绍,建议 直接看原版文档,这里仅介绍几个重要参数,其他内容不再赘述。
- init 参数提供了三种产生筷中心的方法:“K-means++”指定产生较大间距的筷中心(2.1.4节);“random”指定随机产生簇中心;由用户通过一个ndarrav 数组指定初始筷中心。
- n_init 参数指定了算法运行次数,它在不指定初始筷中心时,通过多次运行算法,最终选择最好的结果作为输出。
- max iter 参数指定了一次运行中的最大迭代次数。在大规模数据集中,算法往往要耗费大量的时间,可通过指定迭代次数来折中耗时和效果。
- tol 参数指定了算法收敛的國值。在大规模数据集中,算法往往难以完全收敛,即达到连续两次相同的分筷需要耗费很长时间,可通过指定國值来折中耗时和最优目标。
- algorithm 参数指定了是否采用elkan k-means 算法来简化距离计算。该算法比经典的k-means 算法在迭代速度方面有很大的提高。但该算法不适用于稀疏的样本数据。值“full”指定采用经典k-means 算法。值“ellkan”指定采用 elkan k-means 算法。值“auto”自动选择,在稠密数据时采用 elkan k-means 算法,在稀疏数据时采用经典k-means 算法。