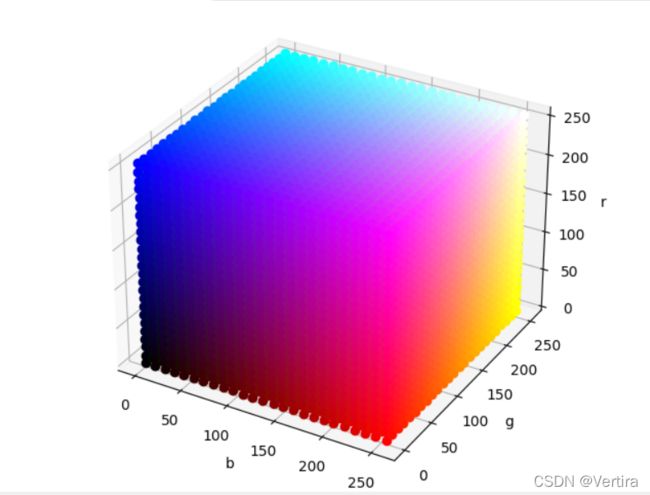
python 绘制RGB三维颜色空间色谱图(已实现)
。。。。。。。。。。。。。。。。。。。。。。。。。。。。。。。。。。。。。。。。。。。。。。。。。。。。。。。。。。。。。。。。。。。。。。。。。。。。。。。。。。。。。。。。。。。。。。。。。。。。。。。。。。。。。。。。。。。。。。。。。。。。。。。。。。。。。。。。。。。。。。。直接上代码。。。。。。。。。。。。。。。。。。
import matplotlib.pyplot as plt
import numpy as np
from mpl_toolkits.mplot3d import Axes3D

fig = plt.figure()  # 定义新的三维坐标轴
ax = Axes3D(fig)

size = 25
points = np.linspace(0, 255, size).astype(np.int32)

for x in points:
    for y in points:
        for z in points:
            ax.plot([x], [y], [z], "ro", color=(x / 255, y / 255, z / 255, 1))
print('---')
ax.set_zlabel('r')
ax.set_ylabel('g')
ax.set_xlabel('b')
plt.show()
。。。。。。。。。。。。。。。。。。。。。。。。。。。。。。。。。。。。。。。。。。。。。。。。。。。。。。。。。。。。。。。。。。。。。。。。。。。。。。。。。。。。。。。。。。。。。。。。。。。。。。。。。。。。。。。。。。。。。。。。。。。。。。。。。
运行效果图如下。。。
