【深度学习入门:基于Python的理论与实现】书本学习笔记 第三章 神经网络
文章目录
- 1. 阶跃函数的实现
- 2. 函数图形
-
- 2.1 阶跃函数
- 2.2 sigmoid 函数
- 2.3 ReLU 函数
- 3. 多维数组的运算
-
- 3.1 矩阵乘法
- 3.2 神经网络的内积
- 4. 三层神经网络的实现
-
- 4.1 第零层(input)到第一层的输入
- 4.2 第一层到第二层的输入
- 4.4 将之前的权重参数整合
- 5. Softmax 函数
-
- 5.1将上面的代码转换为softmax函数
- 6. 使用MNIST数据集
-
- 数据集使用方法
- 数据集下载方法
- 6.2 神经网络的推理处理
- 7. 批处理
-
- 7.1 基于批处理的代码实现
- 写在最后
1. 阶跃函数的实现
import numpy as np
## Version1 只能接收浮点数的操作
# def step_function(x):
#     if x > 0:
#         return 1
#     else:
#         return 0
# Numpy版本
def step_function(x):
    y = x > 0
    return y.astype(np.int)
# 上述函数内容的具体实现
import numpy as np

x = np.array([-1.0, 1.0, 2.0])
x
array([-1., 1., 2.])
# 通过条件判断返回bool数组
y = x > 0
y
array([False, True, True])
进行运算后,数组中大于0的数字转为True,小于0的数转为False
我们使用True和False进行强制转换为0和1
y = y.astype(np.int)
y
array([0, 1, 1])
2. 函数图形
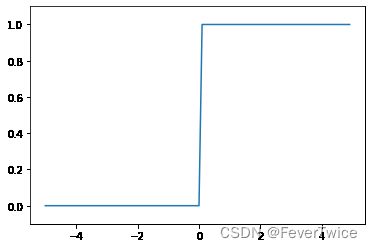
2.1 阶跃函数
import numpy as np
import matplotlib.pyplot as plt

def step_function(x):
    return np.array(x > 0, dtype=np.int)

x = np.arange(-5.0, 5.0, 0.1)
y = step_function(x)
plt.plot(x, y)
plt.ylim(-0.1, 1.1) # 指定y的范围
plt.show()
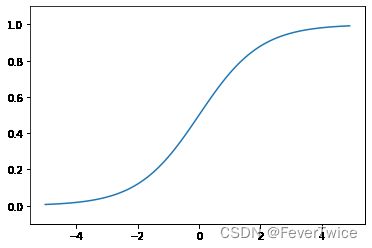
2.2 sigmoid 函数
def sigmoid(x):
    # 使用了Numpy的广播功能
    # 参数传入为Numpy数组时候也能被正确计算
    return 1 / (1 + np.exp(-x))
x = np.array([-1.0, 1.0, 2.0])
sigmoid(x)
array([0.26894142, 0.73105858, 0.88079708])
t = np.array([1.0, 2.0, 3.0])
1.0 + t
array([2., 3., 4.])
1.0 / t
array([1. , 0.5 , 0.33333333])
虽然使用了标量对数组进行计算,但是运算的结果却是以向量的形式输出
x = np.arange(-5.0, 5.0, 0.1)
y = sigmoid(x)
plt.plot(x, y)
plt.ylim(-0.1, 1.1)
plt.show()
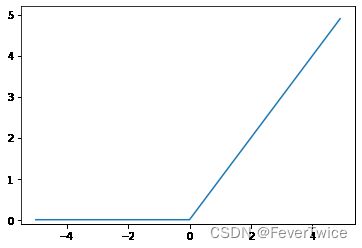
2.3 ReLU 函数
def relu(x):
    return np.maximum(0, x)
y2 = relu(x);
plt.plot(x, y2)
plt.ylim(-0.1, 5.2)
plt.show()
3. 多维数组的运算
import numpy as np
A = np.array([1, 2, 3, 4])
print(A)
[1 2 3 4]
np.ndim(A) # 获取A的维度数
1
A.shape # 为了和二维、三维的结果一致,范围类型是一个元组
(4,)
A.shape[0]
4
# 生成一个二维数组
B = np.array([[1, 2], [3, 4], [5, 6]])
print(B)
[[1 2]
 [3 4]
 [5 6]]
np.ndim(B)
2
B.shape
(3, 2)
3.1 矩阵乘法
A = np.array([[1, 2], [3, 4]])
A.shape
(2, 2)
B = np.array([[5, 6], [7, 8]])
B.shape
(2, 2)
np.dot(A, B)
array([[19, 22],
       [43, 50]])
# 矩阵相乘的维度需要保持一致
A = np.array([[1, 2], [3, 4], [5, 6]])
A.shape
(3, 2)
B = np.array([7, 8])
B.shape
(2,)
np.dot(A, B)
array([23, 53, 83])
C = np.array([[7], [8]])
np.dot(A, C)
array([[23],
       [53],
       [83]])
3.2 神经网络的内积
X = np.array([1, 2])
X.shape
(2,)
W = np.array([[1, 3, 5], [2, 4, 6]])
print(W)
[[1 3 5]
 [2 4 6]]
W.shape
(2, 3)
Y = np.dot(X, W)
print(Y)
[ 5 11 17]
4. 三层神经网络的实现
4.1 第零层(input)到第一层的输入
X = np.array([1.0, 0.5])
W1 = np.array([[0.1, 0.3, 0.5], [0.2, 0.4, 0.6]])
B1 = np.array([0.1, 0.2, 0.3])

print(X.shape)
print(W1.shape)
print(B1.shape)
(2,)
(2, 3)
(3,)
# 计算前馈值
A1 = np.dot(X, W1) + B1
# 激活函数
Z1 = sigmoid(A1)

print(A1)
print(Z1)
[0.3 0.7 1.1]
[0.57444252 0.66818777 0.75026011]
4.2 第一层到第二层的输入
W2 = np.array([[0.1, 0.4], [0.2, 0.5], [0.3, 0.6]])
B2 = np.array([0.1, 0.2])

print(Z1.shape)
print(W2.shape)
print(B2.shape)
(3,)
(3, 2)
(2,)
# 第二层计算
A2 = np.dot(Z1, W2) + B2
Z2 = sigmoid(A2)
# 恒等函数
def identity_function(x):
    return x
W3 = np.array([[0.1, 0.3], [0.2, 0.4]])
B3 = np.array([0.1, 0.2])
A3 = np.dot(Z2, W3) + B3
Y = identity_function(A3)
4.4 将之前的权重参数整合
def init_network():
    # 使用字典的方式来存储网络参数
    network = {}
    network['W1'] = np.array([[0.1, 0.3, 0.5], [0.2, 0.4, 0.6]])
    network['B1'] = np.array([0.1, 0.2, 0.3])
    network['W2'] = np.array([[0.1, 0.4], [0.2, 0.5], [0.3, 0.6]])
    network['B2'] = np.array([0.1, 0.2])
    network['W3'] = np.array([[0.1, 0.3], [0.2, 0.4]])
    network['B3'] = np.array([0.1, 0.2])
    return network

def forward(network, x):
    W1, W2, W3 = network['W1'], network['W2'], network['W3']
    b1, b2, b3 = network['B1'], network['B2'], network['B3']

    a1 = np.dot(x, W1) + b1
    z1 = sigmoid(a1)

    a2 = np.dot(z1, W2) + b2
    z2 = sigmoid(a2)

    # 最后一层不用sig函数
    a3 = np.dot(z2, W3) + b3
    y = identity_function(a3)

    return y
network = init_network()
x = np.array([1.0, 0.5])
y = forward(network, x)

print(y)
[0.31682708 0.69627909]
5. Softmax 函数
a = np.array([0.3, 2.9, 4.0])

exp_a = np.exp(a) # 指数函数
print(exp_a)
[ 1.34985881 18.17414537 54.59815003]
sum_exp_a = np.sum(exp_a)
print(sum_exp_a)
74.1221542101633
y = exp_a / sum_exp_a
print(y)
[0.01821127 0.24519181 0.73659691]
5.1将上面的代码转换为softmax函数
def softmax(a):
    exp_a = np.exp(a)
    sum_exp_a = np.sum(exp_a)

    y = exp_a / sum_exp_a

    return y
上述做法存在问题,在进行指数计算的时候,函数会溢出,如下
a = np.array([1010, 1000, 990])
np.exp(a) / np.sum(np.exp(a)) # softmax函数中指数的计算
E:\develop_tools\Anaconda\envs\py36\lib\site-packages\ipykernel_launcher.py:2: RuntimeWarning: overflow encountered in exp

E:\develop_tools\Anaconda\envs\py36\lib\site-packages\ipykernel_launcher.py:2: RuntimeWarning: invalid value encountered in true_divide


array([nan, nan, nan])
上述的函数报错了,综上,我们可以像下面一般实现softmax函数
def softmax(a):
    # 找到最大值并相减
    c = np.max(a)
    exp_a = np.exp(a - c)

    sum_exp_a = np.sum(exp_a)

    y = exp_a / sum_exp_a

    return y
# 这样子做了之后的操作不会改变y的输出数值
# 参考Block47的输出(相同)

a = np.array([0.3, 2.9, 4.0])
y = softmax(a)
print(y)
[0.01821127 0.24519181 0.73659691]
6. 使用MNIST数据集
数据集使用方法
Tips:将下载下来的源代码中的ch3、dataset复制到记事本的目录下,后面就能成功import了,如下图

数据集下载方法
下载地址:
深度学习入门:基于Python的理论与实现
# 导入数据集
import sys, os
sys.path.append(os.pardir) # 导入父目录
from dataset.mnist import load_mnist

# 调用
(x_train, t_train), (x_test, t_test) = load_mnist(flatten = True, normalize = False)

# 输出形状
print("训练集数据输入", x_train.shape)
print("训练集标签输出",t_train.shape)
print("测试集数据输入",x_test.shape)
print("测试集标签输出",t_test.shape)
训练集数据输入 (60000, 784)
训练集标签输出 (60000,)
测试集数据输入 (10000, 784)
测试集标签输出 (10000,)
import sys, os
sys.path.append(os.pardir)
import numpy as np
from dataset.mnist import load_mnist
from PIL import Image

# 显示图片
def img_show(img):
    pil_img = Image.fromarray(np.uint8(img))
    pil_img.show()

(x_train, t_train), (x_test, t_test) = load_mnist(flatten = True, normalize = False)
img = x_train[0]
label = t_train[0]

print("图像类别 ", label)
print("图像大小 ", img.shape)

print("改变图像的尺寸......")
img = img.reshape(28, 28) # 改回原来大小
print("改变后的尺寸", img.shape)

img_show(img)
图像类别  5
图像大小  (784,)
改变图像的尺寸......
改变后的尺寸 (28, 28)
6.2 神经网络的推理处理
def get_data():
    (x_train, t_train), (x_test, t_test) = \
        load_mnist(flatten = True, normalize = True, one_hot_label = False)
    return x_test, t_test

def init_network():
    with open("ch03/sample_weight.pkl", 'rb') as f:
        network = pickle.load(f)

    return network

def predict(network, x):
    W1, W2, W3 = network['W1'], network['W2'], network['W3']
    b1, b2, b3 = network['b1'], network['b2'], network['b3']

    a1 = np.dot(x, W1) + b1
    z1 = sigmoid(a1)

    a2 = np.dot(z1, W2) + b2
    z2 = sigmoid(a2)

    a3 = np.dot(z2, W3) + b3
    y = softmax(a3)

    return y
import pickle

x, t = get_data()
network = init_network()

accuracy_cnt = 0
for i in range(len(x)):
    y = predict(network, x[i])
    p = np.argmax(y)  # 获取概率最高的元素的索引
    if p == t[i]:
        accuracy_cnt += 1

print("Accuracy: " + str(float(accuracy_cnt) / len(x)))
Accuracy: 0.9352
7. 批处理
x, _ = get_data()
network = init_network()
W1, W2, W3 = network['W1'], network['W2'], network['W3']
x.shape
(10000, 784)
x[0].shape
(784,)
W1.shape
(784, 50)
W2.shape
(50, 100)
W3.shape
(100, 10)
7.1 基于批处理的代码实现
x, t = get_data()
network = init_network()

batch_size = 100 # 批处理数量
accuracy_cnt = 0

# 从0开始,以每个batch为步长遍历
for i in range(0, len(x), batch_size):
    x_batch = x[i: i + batch_size] # batch_size * 784
    y_batch = predict(network, x_batch) # 整个批次放进去 y_batch: batch * 10

    # 预测向量
    p = np.argmax(y_batch, axis = 1) # 行方向最大对应的下标

    accuracy_cnt += np.sum(p == t[i: i + batch_size]) # 相等的为True,相加为正确的个数

print("Accuracy: " + str(float(accuracy_cnt) / len(x)))
Accuracy: 0.9352
x = np.array([[0.1, 0.8, 0.1],
              [0.3, 0.1, 0.6],
              [0.2, 0.5, 0.3],
              [0.8, 0.1, 0.1]])

# 注意是取最大的下标,不是最大的值
y = np.argmax(x, axis = 1)
print(y)
[1 2 1 0]
t = np.array([1, 2, 0, 0])
print(t == y)
[ True True False True]
np.sum(t==y)
3
写在最后
各位看官,都看到这里了,麻烦动动手指头给博主来个点赞8,您的支持作者最大的创作动力哟!
才疏学浅,若有纰漏,恳请斧正
本文章仅用于各位作为学习交流之用,不作任何商业用途,若涉及版权问题请速与作者联系,望悉知


