如何使用OpenCV计算机视觉检测帕金森病图片
在本教程中,您将学习如何使用OpenCV和机器学习在手绘的螺旋和波浪图像中自动检测帕金森病。
本教程来自来自巴西的博士生Joao。
Joao有兴趣利用计算机视觉和机器学习基于几何图形(即螺旋和符号波)自动检测和预测帕金森病。
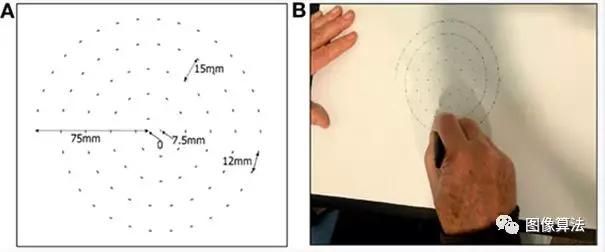
虽然我对帕金森病很熟悉,但我还没有听说过几何绘图测试 - 一些研究让我得到了一篇2017年论文,用复合速度指数和绘制螺旋笔压来区分帕金森病的不同阶段, Zham等人。
研究人员发现,帕金森病患者的拔牙速度较慢,笔压较低 - 这 对于患有更急性/晚期疾病的患者尤其明显。
帕金森症的症状之一是肌肉颤抖和僵硬,使得绘制光滑的螺旋和波浪变得更加困难。
Joao假设有可能仅使用图纸检测帕金森病,而不是必须测量笔在纸上的速度和压力。
降低跟踪笔速度和压力的要求:
- 在执行测试时无需额外的硬件。
- 使自动检测帕金森氏症变得更加容易。
Joao及其顾问慷慨地允许我访问他们收集的由(1)帕金森病患者和(2)健康参与者绘制的螺旋和波浪的数据集。
我看了一下数据集并考虑了我们的选择。
最初,Joao希望将深度学习应用于该项目,但经过考虑,我仔细解释过,深度学习虽然功能强大,但 并不总是适合这项工作的工具!例如,你不会想用锤子来拧螺丝。
相反,你看看你的工具箱,仔细考虑你的选择,并抓住正确的工具。
我向Joao解释了这一点,然后演示了我们如何使用标准计算机视觉和机器学习算法以83.33%的准确率 预测帕金森的图像 。
要学习如何应用计算机视觉和OpenCV来检测基于几何图形的帕金森症,请继续阅读!
使用OpenCV,计算机视觉和螺旋/波浪测试检测帕金森症
在本教程的第一部分中,我们将简要讨论帕金森病,包括几何图形如何用于检测和预测帕金森病。
然后,我们将检查从有和没有帕金森病的患者中收集的图纸数据集。
在查看数据集之后,我将教授如何使用HOG图像描述符来量化输入图像,然后教我们如何在提取的特征之上训练随机森林分类器。
我们将通过检查结果来结束。
什么是帕金森病?
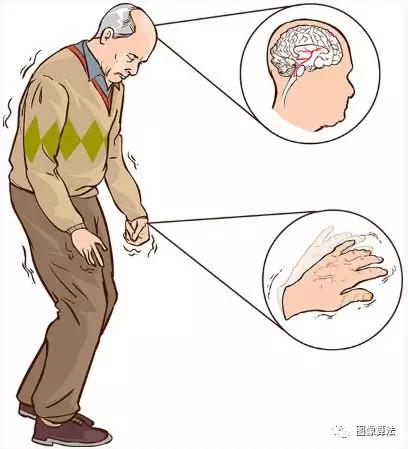
图1:帕金森病患者有神经系统问题。症状包括运动问题,如震颤和僵硬。在这篇博文中,我们将使用OpenCV和机器学习从螺旋和波浪组成的手绘图中检测帕金森病。
帕金森病是一种影响运动的神经系统疾病。该疾病是进行性的,并且由五个不同阶段标记。
- 第1阶段:轻度症状不典型的日常生活,包括只震颤和运动干涉问题一个身体一侧。
- 第2阶段:症状继续与双方震颤和刚性现在影响到变得更糟两个身体的两侧。日常任务变得具有挑战
- 第3阶段:失去平衡和运动随着跌倒变得频繁和普遍。患者仍然能够(通常)独立生活。
- 第4阶段:症状变得严重和受限制。患者无法独自生活,需要帮助才能进行日常活动。
- 第五阶段:可能无法行走或站立。患者最有可能坐轮椅,甚至可能出现幻觉。
虽然帕金森病无法治愈,但早期检测和适当的药物治疗可以显着改善症状和生活质量,使其成为计算机视觉和机器学习从业者探索的重要课题。
绘制螺旋和波浪来检测帕金森病
Zham等人2017年的一项研究。发现可以通过让患者画螺旋然后跟踪来检测帕金森病:
- 绘图速度
- 笔压力
研究人员发现,帕金森病患者的拔牙速度较慢,笔压较低 - 尤其如此对于患有更急性/晚期疾病明显。
我们将利用两个最常见的帕金森症状包括震颤和肌肉僵硬这一事实直接影响手绘螺旋和波浪的视觉外观。
视觉外观的变化将使我们能够训练计算机视觉+机器学习算法以自动检测帕金森病。
螺旋和波浪数据集
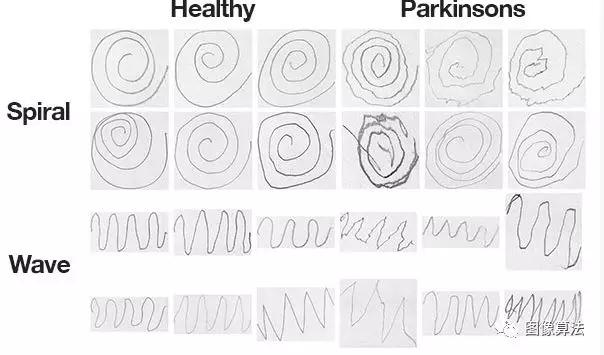
图3:今天的帕金森图像数据集由来自Uberlândia联邦大学NIATS的Andrade和Folado策划。我们将使用Python和OpenCV来训练一个模型,用于从类似的螺旋/波浪图纸中自动分类帕金森氏症
数据集本身由204个图像组成,并预先分成训练集和测试集,包括:
- 螺旋: 102个图像,72个训练和30个测试
- Wave: 102张图片,72次训练和30次测试
上面的图3示出了每个附图和相应类的示例。
虽然对于一个人来说,如果不是不可能的话,一些人在这些图纸中对帕金森氏症与健康状况进行分类是有挑战性的,但其他人在视觉外观上表现出明显的偏差 - 我们的目标是量化这些图纸的视觉外观然后训练机器学习模型对它们进行分类。
为今天的项目准备计算环境
今天的环境可以直接在您的系统上启动和运行。
您将需要以下软件:
- OpenCV的
- NumPy的
- Scikit学习
- Scikit图像
- imutils
每个包都可以使用Python的包管理器pip安装。
$ workon cv # insert your virtual environment name such as `cv`
$ pip install opencv-contrib-python # see the tutorial linked above
$ pip install scikit-learn
$ pip install scikit-image
$ pip install imutils
项目结构
zip文件包含螺旋和波形数据集以及单个Python脚本。
您可以 在终端中使用 tree命令来检查文件和文件夹的结构:
Detecting Parkinson's Disease with OpenCV, Computer Vision, and the Spiral/Wave TestShell
$ tree --dirsfirst --filelimit 10
.
├── dataset
│ ├── spiral
│ │ ├── testing
│ │ │ ├── healthy [15 entries]
│ │ │ └── parkinson [15 entries]
│ │ └── training
│ │ ├── healthy [36 entries]
│ │ └── parkinson [36 entries]
│ └── wave
│ ├── testing
│ │ ├── healthy [15 entries]
│ │ └── parkinson [15 entries]
│ └── training
│ ├── healthy [36 entries]
│ └── parkinson [36 entries]
└── detect_parkinsons.py
15 directories, 1 file
我们的 数据集/ 首先分解为 螺旋/ 和 波/ 。每个文件夹进一步分为 testing / 和training / 。最后,我们的图像位于 健康/ 或 帕金森/ 文件夹中。
我们今天将审查一个Python脚本: detect_parkinsons .py 。该脚本将读取所有图像,提取特征并训练机器学习模型。最后,结果将以蒙太奇显示。
实施帕金森探测器脚本
为了实现我们的帕金森探测器,您可能会倾向于在这个问题上投入深度学习和卷积神经网络(CNN) - 但这种方法存在问题。
首先,我们没有太多的训练数据,只有72张图像用于训练。当遇到缺乏跟踪数据时,我们通常应用数据增强 - 但在此上下文中的数据增加也存在问题。
您需要非常小心,因为不正确地使用数据增加可能会使健康的患者的绘图看起来像帕金森病患者的绘图(反之亦然)。
更重要的是,有效地将计算机视觉应用于问题就是将正确的工具带到工作中 - 例如,你不会用螺丝刀敲打钉子。
仅仅因为您可能知道如何将深度学习应用于问题并不一定意味着深度学习“始终”是问题的最佳选择。
在这个例子中,我将向您展示如果训练数据量有限,方向梯度直方图(HOG)图像描述符以及随机森林分类器如何能够很好地执行。
打开一个新文件,将其命名为 detect_parkinsons .py ,然后插入以下代码:
# import the necessary packages
from sklearn.ensemble import RandomForestClassifier
from sklearn.preprocessing import LabelEncoder
from sklearn.metrics import confusion_matrix
from skimage import feature
from imutils import build_montages
from imutils import paths
import numpy as np
import argparse
import cv2
import os
def quantify_image(image):
# compute the histogram of oriented gradients feature vector for
# the input image
features = feature.hog(image, orientations=9,
pixels_per_cell=(10, 10), cells_per_block=(2, 2),
transform_sqrt=True, block_norm="L1")
# return the feature vector
return features
def load_split(path):
# grab the list of images in the input directory, then initialize
# the list of data (i.e., images) and class labels
imagePaths = list(paths.list_images(path))
data = []
labels = []
# loop over the image paths
for imagePath in imagePaths:
# extract the class label from the filename
label = imagePath.split(os.path.sep)[-2]
# load the input image, convert it to grayscale, and resize
# it to 200x200 pixels, ignoring aspect ratio
image = cv2.imread(imagePath)
image = cv2.cvtColor(image, cv2.COLOR_BGR2GRAY)
image = cv2.resize(image, (200, 200))
# threshold the image such that the drawing appears as white
# on a black background
image = cv2.threshold(image, 0, 255,
cv2.THRESH_BINARY_INV | cv2.THRESH_OTSU)[1]
# quantify the image
features = quantify_image(image)
# update the data and labels lists, respectively
data.append(features)
labels.append(label)
# return the data and labels
return (np.array(data), np.array(labels)
# construct the argument parser and parse the arguments
ap = argparse.ArgumentParser()
ap.add_argument("-d", "--dataset", required=True,
help="path to input dataset")
ap.add_argument("-t", "--trials", type=int, default=5,
help="# of trials to run")
args = vars(ap.parse_args()
# define the path to the training and testing directories
trainingPath = os.path.sep.join([args["dataset"], "training"])
testingPath = os.path.sep.join([args["dataset"], "testing"])
# loading the training and testing data
print("[INFO] loading data...")
(trainX, trainY) = load_split(trainingPath)
(testX, testY) = load_split(testingPath)
# encode the labels as integers
le = LabelEncoder()
trainY = le.fit_transform(trainY)
testY = le.transform(testY)
# initialize our trials dictionary
trials =
# loop over the number of trials to run
for i in range(0, args["trials"]):
# train the model
print("[INFO] training model {} of {}...".format(i + 1,
args["trials"]))
model = RandomForestClassifier(n_estimators=100)
model.fit(trainX, trainY)
# make predictions on the testing data and initialize a dictionary
# to store our computed metrics
predictions = model.predict(testX)
metrics = {}
# compute the confusion matrix and and use it to derive the raw
# accuracy, sensitivity, and specificity
cm = confusion_matrix(testY, predictions).flatten()
(tn, fp, fn, tp) = cm
metrics["acc"] = (tp + tn) / float(cm.sum())
metrics["sensitivity"] = tp / float(tp + fn)
metrics["specificity"] = tn / float(tn + fp)
# loop over the metrics
for (k, v) in metrics.items():
# update the trials dictionary with the list of values for
# the current metric
l = trials.get(k, [])
l.append(v)
trials[k] = l
# loop over our metrics
for metric in ("acc", "sensitivity", "specificity"):
# grab the list of values for the current metric, then compute
# the mean and standard deviation
values = trials[metric]
mean = np.mean(values)
std = np.std(values)
# show the computed metrics for the statistic
print(metric)
print("=" * len(metric))
print("u={:.4f}, o={:.4f}".format(mean, std))
print("
# randomly select a few images and then initialize the output images
# for the montage
testingPaths = list(paths.list_images(testingPath))
idxs = np.arange(0, len(testingPaths))
idxs = np.random.choice(idxs, size=(25,), replace=False)
images = []
# loop over the testing samples
for i in idxs:
# load the testing image, clone it, and resize it
image = cv2.imread(testingPaths[i])
output = image.copy()
output = cv2.resize(output, (128, 128))
# pre-process the image in the same manner we did earlier
image = cv2.cvtColor(image, cv2.COLOR_BGR2GRAY)
image = cv2.resize(image, (200, 200))
image = cv2.threshold(image, 0, 255,
cv2.THRESH_BINARY_INV | cv2.THRESH_OTSU)[1]
# quantify the image and make predictions based on the extracted
# features using the last trained Random Forest
features = quantify_image(image)
preds = model.predict([features])
label = le.inverse_transform(preds)[0]
# draw the colored class label on the output image and add it to
# the set of output images
color = (0, 255, 0) if label == "healthy" else (0, 0, 255)
cv2.putText(output, label, (3, 20), cv2.FONT_HERSHEY_SIMPLEX, 0.5,
color, 2)
images.append(output)
# create a montage using 128x128 "tiles" with 5 rows and 5 columns
montage = build_montages(images, (128, 128), (5, 5))[0]
# show the output montage
cv2.imshow("Output", montage)
cv2.waitKey(0)
我们从第2-11行的进口开始 :
- 我们将大量使用scikit-learn,这在前三个进口中很明显:
- 我们使用的分类器是 RandomForestClassifier 。
- 我们将使用 LabelEncoder 将标签编码为整数。
- 将构建一个 confusion_matrix,以便我们可以获得原始的准确性,灵敏度和特异性。
- 定向梯度直方图(HOG)将来自 scikit-image 的 特征导入。
- 来自imutils的两个模块 将被使用:
- 我们将 build_montages 用于可视化。
- 我们的 路径 导入将帮助我们提取数据集中每个图像的文件路径。
- NumPy将帮助我们计算统计数据并获取随机指数。
- 该 argparse 进口将使我们能够解析命令行参数。
- OpenCV( cv2)将用于读取,处理和显示图像。
- 我们的程序将使用os 模块同时支持Unix和Windows文件路径 。
让我们 用HOG方法定义一个量化波/螺旋图像的函数 :
我们将使用quanty_image 函数从每个输入图像中提取特征 。
Dalal和Triggs在他们的CVPR 2005论文中首次介绍了 人体检测的方向梯度直方图,HOG将用于量化我们的图像。
HOG是一种 结构描述符,用于捕获和量化输入图像中局部梯度的变化。HOG自然能够量化螺旋和波的方向如何变化。
此外,HOG将能够捕捉到这些图纸是否对他们有更多的“震动”,正如我们对帕金森病患者所期望的那样。
HOG的另一个应用是这个PyImageSearch Gurus示例课程。请务必参阅示例课程以获取有关该功能的完整说明 参数。
得到的特征是量化波或螺旋的12,996-dim特征向量(数字列表)。我们将在数据集中所有图像的特征之上训练随机森林分类器。
继续,让我们加载我们的数据并提取功能:
该 load_split 函数接受数据集的目标, 路径 和返回的所有特征 数据 和相关类 的标签 。让我们一步一步地分解它:
- 该函数被定义为接受第23行 上数据集的 路径(波形或螺旋形) 。
- 从那里我们抓住输入 imagePaths ,利用imutils(第26行)。
- 这两个 数据 和 标签 列表被初始化(行27和28)。
- 从那里 开始,我们遍历从第31行开始的所有 imagePath:
- 从路径中提取每个 标签(第33行)。
- 加载并预处理每个 图像(第37-44行)。阈值处理步骤从输入图像中分割绘图,使绘图在黑色背景上显示为 白色前景 。
- 通过我们的quanty_image 函数提取特征 (第47行)。
- 的 特征 和 标签 被附加到 数据 和 标签 分别列表(线50-51)。
- 最后, 数据 和 标签 被转换为NumPy数组,并在元组中方便地返回(第54行)。
让我们继续并解析我们的命令行参数:
我们的脚本处理两个命令行参数:
- - dataset :输入数据集的路径(波形或螺旋形)。
- - 试验 :试运行的次数(默认我们进行 5次 试验)。
为了准备培训,我们将执行初始化:
在这里,我们正在构建培训和测试输入目录的路径(第65和66行)。
从那里我们通过将每个路径传递给load_split来加载我们的训练和测试分裂 (第70和71行)。
我们的 试用 词典在第79行初始化 (回想一下,默认情况下我们将进行 5次 试验)。
让我们现在开始我们的试验:
在 第82行,我们遍历每个试验。在每个试验中,我们:
- 初始化我们的随机森林分类器并训练模型(第86和87行)。有关随机森林的更多信息,包括它们如何在计算机视觉环境中使用,请务必参考 PyImageSearch Gurus。
- 请 预测 上测试数据(91号线)。
- 计算准确度,灵敏度和特异性 指标 (第96-100行)。
- 更新我们的 试用 词典(第103-108行)。
循环遍历每个指标,我们将打印统计信息:
在第111行,我们遍历每个 指标 。
然后我们继续 从 试验中获取 值 (第114行)。
使用这些 值 ,计算每个度量的平均值和标准偏差(第115和116行)。
从那里,统计数据显示在终端中。
现在是眼睛糖果 - 我们将创建一个蒙太奇,以便我们可以直观地分享我们的工作:
首先,我们从我们的测试集中随机抽样图像(第126-128行)。
我们的 图像 列表将保存每个波形或螺旋图像以及通过OpenCV绘图功能添加的注释(第129行)。
我们继续循环第132行的随机图像索引 。
在循环内部,每个图像以与训练期间相同的方式处理(第134-142行)。
从那里我们将使用我们基于HOG + Random Forest的新分类器自动对图像进行分类,并添加颜色编码的注释:
每个 图像 用HOG 特征量化 (第146行)。
然后通过将这些特征传递 给模型来 对图像进行分类 。预测 (第147和148行)。
类标签的颜色为绿色,表示 “健康” ,红色表示红色(第152行)。该 标签 被绘制在图像(的左上角线153和154)。
然后将每个 输出图像添加到 图像 列表(第155行),以便我们可以开发 蒙太奇 (第158行)。您可以通过OpenCV了解有关创建蒙太奇的更多信息 。
该 蒙太奇 然后通过显示 161线,直到按下一个键。
训练帕金森的探测器模型
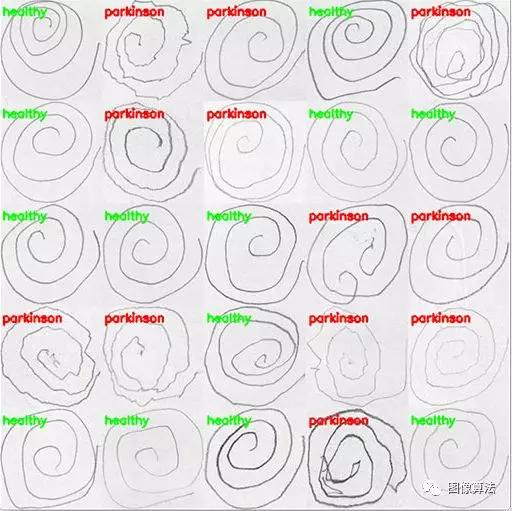
图4:使用Python,OpenCV和机器学习(随机森林),我们使用他们的手绘螺旋对帕金森病患者进行了分类,准确率为83.33%。
让我们的帕金森病检测仪进行测试吧!
使用本教程的“下载”部分下载源代码和数据集。
从那里,导航到您下载.zip文件的位置,取消存档,然后执行以下命令来训练我们的“wave”模型:
$ python detect_parkinsons.py --dataset dataset/wave
[INFO] loading data...
[INFO] training model 1 of 5...
[INFO] training model 2 of 5...
[INFO] training model 3 of 5...
[INFO] training model 4 of 5...
[INFO] training model 5 of 5...
acc
===
u=0.7133, o=0.0452
sensitivity
===========
u=0.6933, o=0.0998
specificity
===========
u=0.7333, o=0.0730
检查我们的输出,你会发现我们在测试集上获得了71.33%的分类准确度,灵敏度为69.33%(真阳性率),特异性为73.33%(真阴性率)。
重要的是我们测量灵敏度和特异性:
- 敏感性衡量的是真正的积极因素,也被预测为积极因素。
- 特异性衡量的是真实的阴性,也被预测为阴性。
机器学习模型,尤其是医疗领域的机器学习模型,在平衡真正的积极因素和真正的负面因素时需要特别小心:
- 我们不想将某人归类为“没有帕金森氏症”,因为他们实际上对帕金森氏症有积极作用。
- 同样地,我们不想将某人归类为“帕金森氏阳性”,而实际上他们没有这种疾病。
现在让我们在“螺旋”图纸上训练我们的模型:
$ python detect_parkinsons.py --dataset dataset/spiral
[INFO] loading data...
[INFO] training model 1 of 5...
[INFO] training model 2 of 5...
[INFO] training model 3 of 5...
[INFO] training model 4 of 5...
[INFO] training model 5 of 5...
acc
===
u=0.8333, o=0.0298
sensitivity
===========
u=0.7600, o=0.0533
specificity
===========
u=0.9067, o=0.0327
这次我们在测试集上达到了83.33%的准确度,灵敏度为76.00%,特异性为90.67%。
从标准偏差来看,我们也可以看到差异越小,分布越紧凑。
时自动在手附图检测帕金森氏病,至少利用该特定数据集的情况下,“螺旋”图纸似乎是许多更多有用的信息。
相关源码关注微信公众号:“图像算法”或者微信搜索账号imalg_cn关注公众号回复parkinson 获取


