python+sklearn样本均衡化和置信概率(基于SVM)
本文所用文件的链接
链接:https://pan.baidu.com/s/1RWNVHuXMQleOrEi5vig_bQ
提取码:p57s
样本类别均衡化
通过样本类别权重的均衡化, 使所占比例较小的样本权重较高,而所占比例较大的样本权重较低, 以此平均化不同类别样本对分类模型的贡献, 提高模型预测性能.
什么情况下会用到样本类别均衡化? 当每个类别的样本容量相差较大时, 有可能会用到样本类别均衡化.
这是原图:明显样本的数量不均衡。

model = svm.SVC(kernel='linear',
                class_weight='balanced')
案例:
"""
demo10_gridsearch.py  网格搜索
"""
import numpy as np
import sklearn.model_selection as ms
import sklearn.svm as svm
import sklearn.metrics as sm
import matplotlib.pyplot as mp

x, y = [],[]
data=np.loadtxt('../ml_data/multiple2.txt',
	 delimiter=',')
x = data[:, :-1]
y = data[:, -1]
# 拆分训练集与测试集
train_x, test_x, train_y, test_y = \
	ms.train_test_split(x, y, test_size=0.25,
	random_state=5)
# 基于svm绘制分类边界
model=svm.SVC()
# 使用网格搜索,获取最优模型超参数
params = [
  {'kernel':['linear'],'C':[1,10,100,1000]},
  {'kernel':['poly'],'C':[1],'degree':[2,3]},
  {'kernel':['rbf'],'C':[1,10,100,1000],
    'gamma':[1, 0.1, 0.01, 0.001]}]
model = ms.GridSearchCV(model, params, cv=5)
model.fit(train_x, train_y)

print(model.best_params_)
print(model.best_score_)
print(model.best_estimator_)


# 绘制分类边界线
l, r = x[:, 0].min()-1, x[:, 0].max()+1
b, t = x[:, 1].min()-1, x[:, 1].max()+1
n = 500
grid_x, grid_y = np.meshgrid(
	np.linspace(l, r, n),
	np.linspace(b, t, n))
# 把grid_x与grid_y抻平了组成模型的输入,预测输出
mesh_x = np.column_stack(
	(grid_x.ravel(), grid_y.ravel()))
pred_mesh_y = model.predict(mesh_x)
grid_z = pred_mesh_y.reshape(grid_x.shape)

# 看一看测试集的分类报告
pred_test_y = model.predict(test_x)
cr = sm.classification_report(
	  	test_y, pred_test_y)
print(cr)

# 绘制这些点
mp.figure('SVM', facecolor='lightgray')
mp.title('SVM', fontsize=16)
mp.xlabel('X', fontsize=14)
mp.ylabel('Y', fontsize=14)
mp.tick_params(labelsize=10)
# mp.pcolormesh(grid_x,grid_y,grid_z,cmap='gray')
mp.scatter(test_x[:,0], test_x[:,1], s=60,
		c=test_y, label='points', cmap='jet')

mp.legend()
mp.show()
置信概率
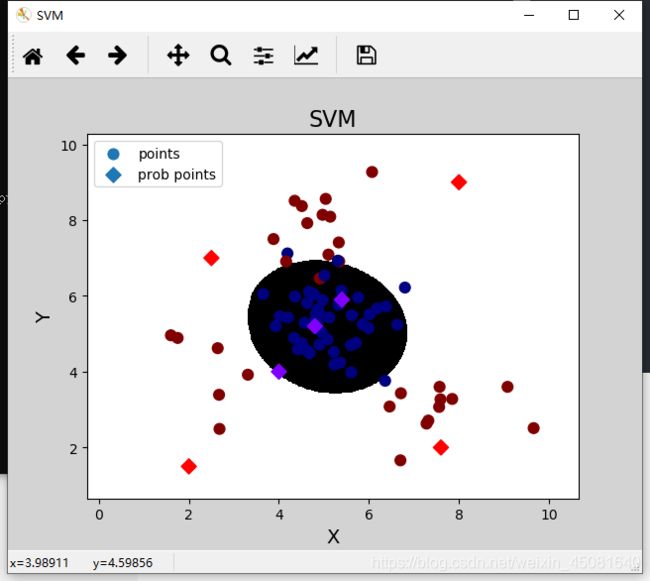
根据样本与分类边界距离的远近, 对其预测类别的可信程度进行量化, 离边界越近的样本, 置信概率越低, 反之则越高.
获取样本的置信概率:
model = svm.SVC(....., probability=True)
pred_test_y = model.predict(test_x)
# 获取每个样本的置信概率
置信概率矩阵 = model.predict_proba(样本矩阵)
置信概率矩阵的结构:
| 类别1 | 类别2 | |
|---|---|---|
| 样本1 | 0.8 | 0.2 |
| 样本2 | 0.3 | 0.7 |
| 样本3 | 0.4 | 0.6 |
"""
demo09_proba.py  输出置信概率
"""
import numpy as np
import sklearn.model_selection as ms
import sklearn.svm as svm
import sklearn.metrics as sm
import matplotlib.pyplot as mp

x, y = [],[]
data=np.loadtxt('../ml_data/multiple2.txt',
	 delimiter=',')
x = data[:, :-1]
y = data[:, -1]
# 拆分训练集与测试集
train_x, test_x, train_y, test_y = \
	ms.train_test_split(x, y, test_size=0.25,
	random_state=5)
# 基于多项式核函数的svm绘制分类边界
model=svm.SVC(kernel='rbf', C=600, gamma=0.01,
	probability=True)
model.fit(train_x, train_y)

# 绘制分类边界线
l, r = x[:, 0].min()-1, x[:, 0].max()+1
b, t = x[:, 1].min()-1, x[:, 1].max()+1
n = 500
grid_x, grid_y = np.meshgrid(
	np.linspace(l, r, n),
	np.linspace(b, t, n))
# 把grid_x与grid_y抻平了组成模型的输入,预测输出
mesh_x = np.column_stack(
	(grid_x.ravel(), grid_y.ravel()))
pred_mesh_y = model.predict(mesh_x)
grid_z = pred_mesh_y.reshape(grid_x.shape)

# 看一看测试集的分类报告
pred_test_y = model.predict(test_x)
cr = sm.classification_report(
	  	test_y, pred_test_y)
print(cr)

# 绘制这些点
mp.figure('SVM', facecolor='lightgray')
mp.title('SVM', fontsize=16)
mp.xlabel('X', fontsize=14)
mp.ylabel('Y', fontsize=14)
mp.tick_params(labelsize=10)
mp.pcolormesh(grid_x,grid_y,grid_z,cmap='gray')
mp.scatter(test_x[:,0], test_x[:,1], s=60,
		c=test_y, label='points', cmap='jet')


# 整理测试样本 , 绘制每个样本的置信概率
prob_x = np.array([
	[2, 1.5],
	[8, 9],
	[4.8, 5.2],
	[4, 4],
	[2.5, 7],
	[7.6, 2],
	[5.4, 5.9]])
pred_prob_y = model.predict(prob_x)
probs = model.predict_proba(prob_x)
print(probs)
mp.scatter(prob_x[:,0], prob_x[:,1], s=60,
		marker='D',
		c=pred_prob_y, label='prob points',
		cmap='rainbow')

mp.legend()
mp.show()
输出置信概率:
[[3.00000090e-14 1.00000000e+00]
 [3.00000090e-14 1.00000000e+00]
 [9.77423836e-01 2.25761639e-02]
 [6.27643285e-01 3.72356715e-01]
 [4.21320088e-03 9.95786799e-01]
 [9.48846926e-11 1.00000000e+00]
 [9.53657546e-01 4.63424544e-02]]
网格搜索
网格搜索是一种选取最优超参数的解决方案.
获取一个最优超参数的方式可以绘制验证曲线, 但是验证曲线只能每次获取一个最优超参数. 如果多个超参数有很多排列组合情况的话, 可以选择使用网格搜索寻求最优超参数的组合.
网格搜索相关API:
import sklearn.model_selection as ms
model = 决策树模型
# 返回分值最高的模型对象
model = ms.GridSearchCV(
    	model, 超参数列表, cv=折叠数)
# 直接训练模型
model.fit(输入集, 输出集)
# 获取最好的超参数
model.best_params_
model.best_score_
model.best_estimator_
案例:
"""
demo10_gridsearch.py  网格搜索
"""
import numpy as np
import sklearn.model_selection as ms
import sklearn.svm as svm
import sklearn.metrics as sm
import matplotlib.pyplot as mp

x, y = [],[]
data=np.loadtxt('../ml_data/multiple2.txt',
	 delimiter=',')
x = data[:, :-1]
y = data[:, -1]
# 拆分训练集与测试集
train_x, test_x, train_y, test_y = \
	ms.train_test_split(x, y, test_size=0.25,
	random_state=5)
# 基于svm绘制分类边界
model=svm.SVC()
# 使用网格搜索,获取最优模型超参数
params = [
  {'kernel':['linear'],'C':[1,10,100,1000]},
  {'kernel':['poly'],'C':[1],'degree':[2,3]},
  {'kernel':['rbf'],'C':[1,10,100,1000],
    'gamma':[1, 0.1, 0.01, 0.001]}]
model = ms.GridSearchCV(model, params, cv=5)
model.fit(train_x, train_y)

print(model.best_params_)
print(model.best_score_)
print(model.best_estimator_)


# 绘制分类边界线
l, r = x[:, 0].min()-1, x[:, 0].max()+1
b, t = x[:, 1].min()-1, x[:, 1].max()+1
n = 500
grid_x, grid_y = np.meshgrid(
	np.linspace(l, r, n),
	np.linspace(b, t, n))
# 把grid_x与grid_y抻平了组成模型的输入,预测输出
mesh_x = np.column_stack(
	(grid_x.ravel(), grid_y.ravel()))
pred_mesh_y = model.predict(mesh_x)
grid_z = pred_mesh_y.reshape(grid_x.shape)

# 看一看测试集的分类报告
pred_test_y = model.predict(test_x)
cr = sm.classification_report(
	  	test_y, pred_test_y)
print(cr)

# 绘制这些点
mp.figure('SVM', facecolor='lightgray')
mp.title('SVM', fontsize=16)
mp.xlabel('X', fontsize=14)
mp.ylabel('Y', fontsize=14)
mp.tick_params(labelsize=10)
mp.pcolormesh(grid_x,grid_y,grid_z,cmap='gray')
mp.scatter(test_x[:,0], test_x[:,1], s=60,
		c=test_y, label='points', cmap='jet')

mp.legend()
mp.show()


