深度学习网络图PlotNeuralNet工具(一):初入门——解析test_sample.py
1. 参考
github地址:https://github.com/HarisIqbal88/PlotNeuralNet
安装方法:windows系统、Ubuntu系统
2. 函数解析
test_simple.py
import sys
sys.path.append('../')
from pycore.tikzeng import *
# defined your arch
arch = [
to_head( '..' ),
to_cor(),
to_begin(),
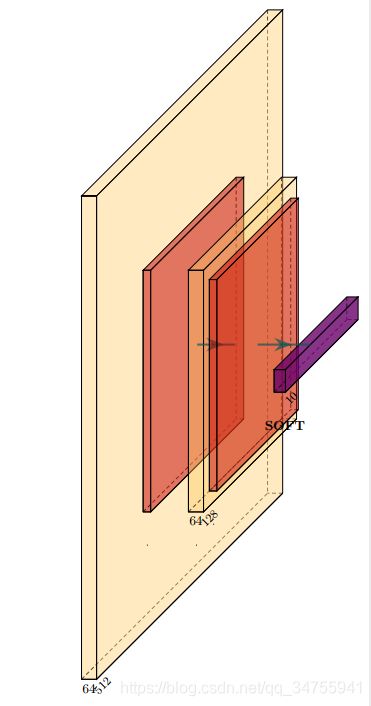
to_Conv("conv1", 512, 64, offset="(0,0,0)", to="(0,0,0)", height=64, depth=64, width=2 ),
to_Pool("pool1", offset="(0,0,0)", to="(conv1-east)"),
to_Conv("conv2", 128, 64, offset="(1,0,0)", to="(pool1-east)", height=32, depth=32, width=2 ),
to_connection( "pool1", "conv2"),
to_Pool("pool2", offset="(0,0,0)", to="(conv2-east)", height=28, depth=28, width=1),
to_SoftMax("soft1", 10 ,"(3,0,0)", "(pool1-east)", caption="SOFT" ),
to_connection("pool2", "soft1"),
to_end()
]
def main():
namefile = str(sys.argv[0]).split('.')[0]
to_generate(arch, namefile + '.tex' )
if __name__ == '__main__':
main()
上述程序是pyexample中的例子,是可以通过 bash …/tikzmake.sh test_simple 直接运行出来的
其中:
to_Conv(“conv1”, 512, 64, offset="(0,0,0)", to="(0,0,0)", height=64, depth=64, width=2 )
| name | “conv1” | 该层的名字 |
|---|---|---|
| s_filer(z_label) | 512 | 写在左下角的z方向的数字 |
| n_filer(x_label) | 64 | 写在左下角的x方向的数字 |
| offset(x,y,z) | (0,0,0) | 和上一个图形在x,y,z方向上的偏移值,若x为1,则图像位于前面1的位置 |
| to(x,y,z) | (0,0,0) | 若为(0,0,0)表示第一个图 |
| height | 64 | 图像的高度 |
| depth | 64 | 图像的深度 |
| width | 2 | 图像的宽度 |
to_Pool(“pool1”, offset="(0,0,0)", to="(conv1-east)"),
| name | “pool1” | 该层的名字 |
|---|---|---|
| offset(x,y,z) | (0,0,0) | 和上一个图形在x,y,z方向上的偏移值,若都为0,则和原图像的位置相同 |
| to(x,y,z) | “(conv1-east)” | 上一个图的name,再加上"-east",跟在name这个图的后面 |
| height | 32 | 若没填,则为上一个图的一半 |
| depth | 32 | 若没填,则为上一个图的一半 |
| width | 1 | 若没填,则为上一个图的一半 |
| opacity | 若为0.5 | 透明度 |
to_SoftMax(“soft1”, 10 ,"(3,0,0)", “(pool1-east)”, caption=“SOFT” )
| name | “soft1” | 该层的名字 |
|---|---|---|
| s_filer(z_label) | 10 | 写在左下角的z方向的数字 |
| offset(x,y,z) | “(3,0,0)” | 和上一个图形在x,y,z方向上的偏移值,若都为0,则和原图像的位置相同 |
| to(x,y,z) | “(pool1-east)” | 上一个图的name,再加上"-east",跟在name这个图的后面 |
| caption | “SOFT” | 描述(会显示在图中) |
to_connection( “pool1”, “conv2”):从哪一个图到哪一个图画个箭头