Multiscale Anisotropic Morphological Directional Derivatives for Noise-Robust Image Edge Detection、
多尺度各向异性形态学方向导数MSAMDD的噪声鲁棒性图像边缘检测
- 第一部分
- Part one
-
- 第二部分
- Part two
-
- 第三部分
-
- 第四部分
-
- 第五部分
- 文献
第一部分
检测流程
方法流程图如图1所示,其中输入图像来自三个数据集。 首先,提出了 MSAMDD 来过滤图像。 其次,使用空间匹配滤波器提取 ESM。 第三,融合了基于定向匹配滤波器的EDM。 然后,应用一系列后处理操作。 最后得到边缘轮廓。

图1 MSAMDD检测流程图
具体的流程可以用下面五个步骤来说明:
1)融合边缘映射的计算:
首先通过公式1:
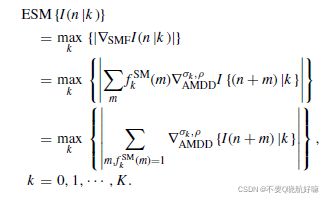
进行边缘强度映射的计算,这当中采用了SMF,即空间匹配滤波器对图像I(n)进行边缘的提取,然后,使用多个尺度融合成的各向异性方向导数响应求最大辐角值构成边缘方向映射。

最后采用拟合乘积技术,对边缘强度和边缘方向映射在局部像素区域进行对比度均衡化得到边缘映射EM。
2)根据1986年伟人Canny提出的边缘检测步骤,采用非极大值抑制策略,对边缘映射图进行全局搜索,根据像素处的模值和梯度方向,进行边缘点的筛选,即将此像素值与其周围的像素点比较,选出比该像素值小的像素点。最后抑制后得到细化的边缘。此步骤可自行根据所需的对比算法进行选取。
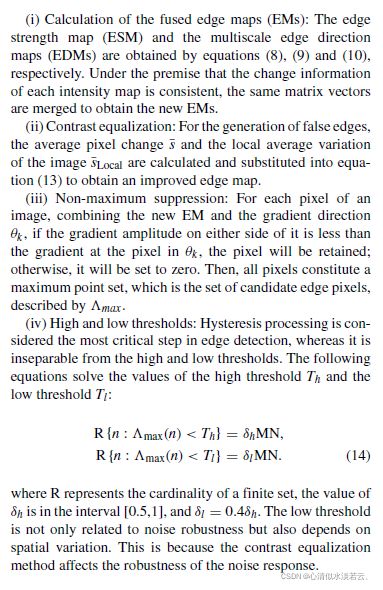
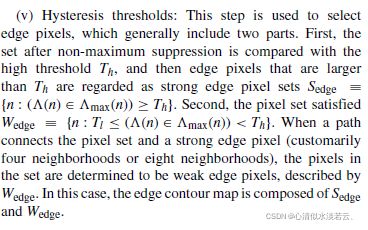
3)阈值选取。为了获得阈值范围的边缘,需要自定义阈值,根据之前研究者的经验,阈值一般在0.4~0.85之内选取,当然此处也可根据熵值或Otus方法选取,但效果未知。一般的,将大于最大阈值的边缘以及大于最小阈值小于最大值阈值的边缘看作是真正的边缘。
Multiscale Anisotropic Morphological Directional Derivatives for Noise-Robust Image Edge Detection
- 第一部分
- Part one
-
- 第二部分
- Part two
-
- 第三部分
-
- 第四部分
-
- 第五部分
- 文献
Part one
The method flow chart is shown in the Figure, where the input images are from three datasets. First, MSAMDDs are proposed to filter the images. Secondly, ESM is extracted by using spatial matching filters. Thirdly, EDMs based on the directional matched filters are fused. Then, a series of post -processing operations are applied. Finally, the edge contours are attained
第二部分
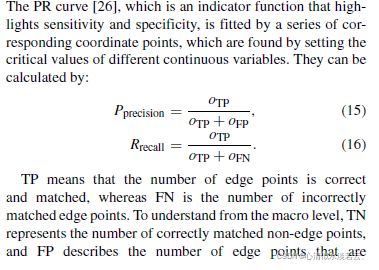
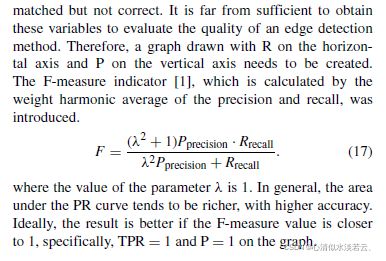
1)选用PR曲线
PR曲线中的P代表的是precision(精准率),R代表的是recall(召回率),其代表的是精准率与召回率的关系,一般情况下,将recall设置为横坐标,precision设置为纵坐标。
PR源码分析
为了搞清楚这个问题, 对源码进行了分析. 如下所示为上图对应的代码:
 from sklearn.metrics  import precision_recall_curve
 import matplotlib.pyplot as plt
 score = np.array([0.9, 0.8, 0.7, 0.6, 0.3, 0.2, 0.1])
 label = np.array([0, 1, 1, 1, 0, 0, 0])
 precision, recall, thres = precision_recall_curve(label, score)
 plt.plot(recall, precision)
 plt.xlabel('Recall')
 plt.ylabel('Precision')
 plt.show()
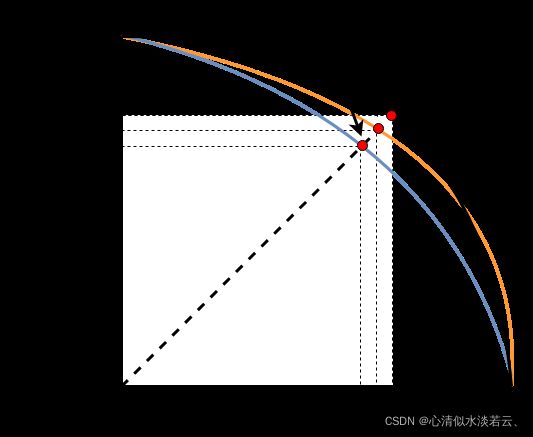
当PR曲线越靠近右上方时,表明模型性能越好,与ROC曲线类似,在对不同模型进行比较时,若一个模型的PR曲线被另一个模型的PR曲线完全包住则说明后者的性能优于前者.如上图中橘色线代表的模型要优于蓝色线代表的模型,若模型的PR曲线发生了交叉,则无法直接判断哪个模型更好.在周志华老师的机器学习上中提到了可以用平衡点.它是查准率=查全率时的取值,如上图黑色线代表的模型的平衡点要大于橘色线模型代表的平衡点,表明前者优于后者,除此之外更为常用的是F1 score,也就是查准率和查全率的加权平均,F1 = (2查准率查全率)/(查准率+查全率)
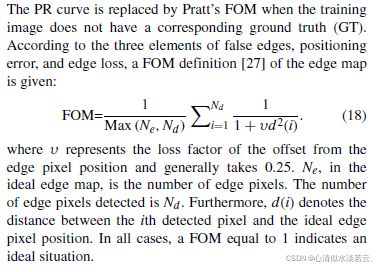
2)FOM
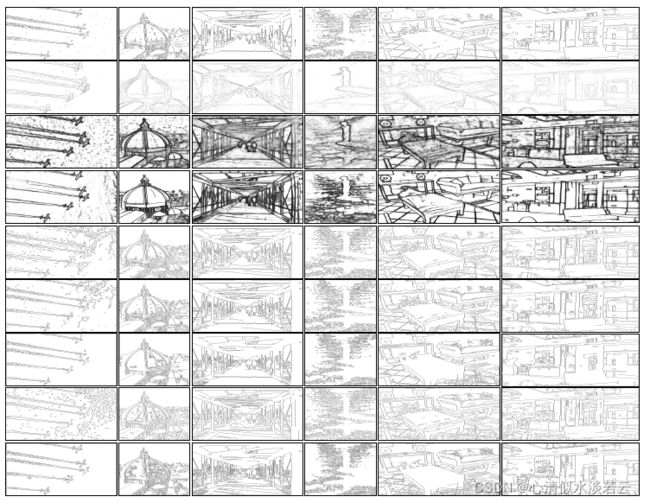
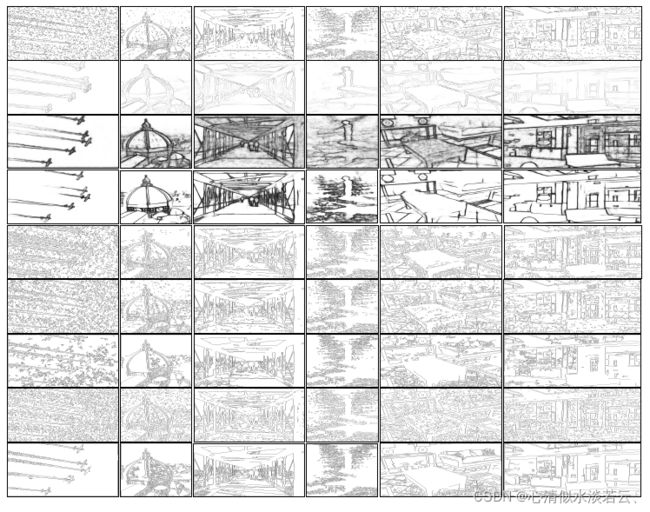
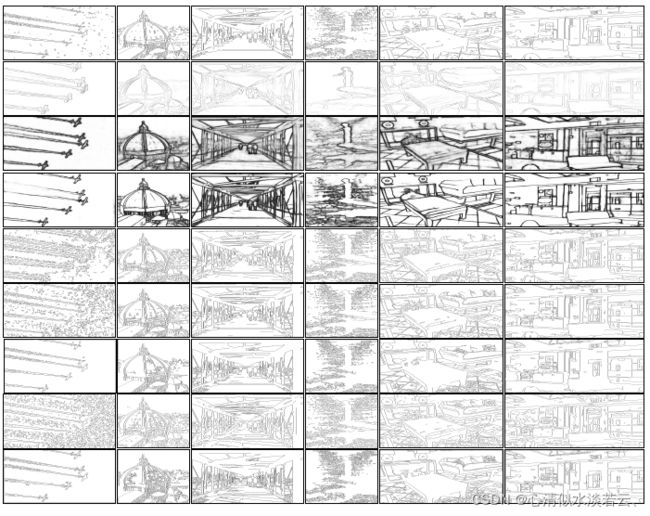
FOM是衡量检测边缘的质量,这当中有一个标准就是GT,但是有的数据集给了GT,有的数据集或者自己制作的数据集当中就不包含GT图,这样就需要专家或者其它第三方技术制造出符合要求的GT图。
一般的,FOM可以根据下式算出:

v是常量,d(i)是检测出边缘图中第i个像素与GT图的像素的距离,Ne是理想或GT图的边缘像素数,Nd是检测边缘的像素数。在做实验的时候,需要根据得到的结果图的数据类型进行FOM评价。
Part two
第三部分
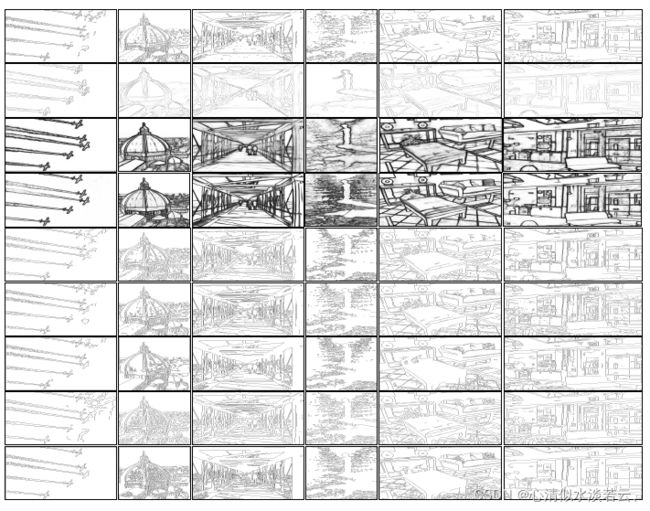
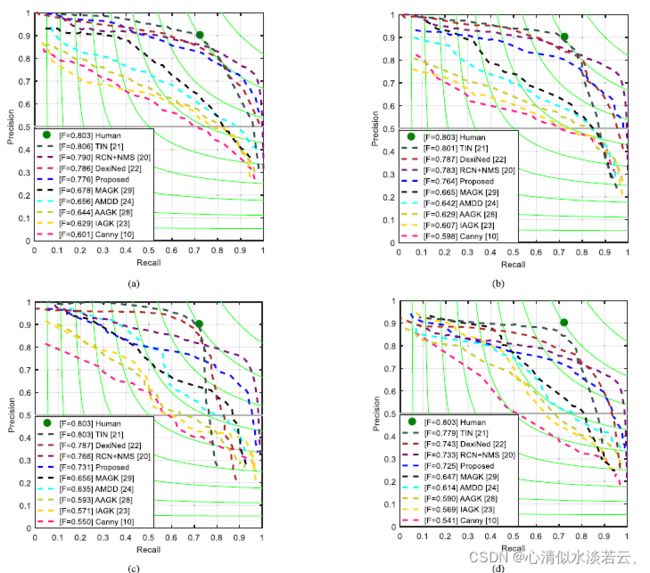
数据集:The Berkeley Segmentation Dataset and Benchmark.、The PASCAL Visual Object Classes Chal-lenge 2007 (VOC2007) Results和NYU Depth Dataset
对比算法:Canny [10], RCN [20], TIN [21], DexiNed [22], IAGK [23],AMDD [24], AAGK [28], and MAGK [29]).部分代码见Github。
第四部分
第五部分
数据见:https://ieeexplore.ieee.org/document/9706179?source=authoralert
Github:仓库地址https://github.com/Navigater23/Edge-detection-tool
论文地址:https://ieeexplore.ieee.org/stamp/stamp.jsp?tp=&arnumber=9706179
文献
[1] Yu X, Wang X, Liu J, et al. Multiscale Anisotropic Morphological Directional Derivatives for Noise-Robust Image Edge Detection[J]. IEEE Access, 2022, 10: 19162-19173.
