需求分析
在做地图开发的时候遇到一个需求,是在 canvas 中绘制 Geojson 数据
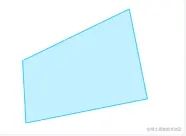
数据格式为 EPSG:4326 的 Polygon:
- 三维数组
- 每一项都是由经纬度组成的
- 第一个点和最后一个点相同,表示
Polygon是闭合的
[
  [
    [109.54420471485196, 35.76192112844663],
    [109.54423617129702, 35.76132766033574],
    [109.54539219590997, 35.76155739029704],
    [109.54521918540507, 35.76241249100947],
    [109.54420471485196, 35.76192112844663],
  ],
];
需求分析:
- 显示在
canvas的中间 - 地图
y轴和屏幕的y轴是相反的,绘制出来的Polygon不能和实际反过来- 屏幕的原点在左上角,地图的原点在左下角
数据处理
width 和 height 是 canvas 的宽高
将经度和纬度单独拆分出来
const getLongitudesAndLatitudes = (coordinates: number[][][]) => {
  return coordinates[0].reduce(
    (pre, cur) => {
      pre.longitudes.push(cur[0]);
      pre.latitudes.push(cur[1]);
      return pre;
    },
    { longitudes: [] as number[], latitudes: [] as number[] }
  );
};
得到的结果是:
const longitudes = [
109.54420471485196, 109.54423617129702, 109.54539219590997,
109.54521918540507, 109.54420471485196,
];
const latitudes = [
35.76192112844663, 35.76132766033574, 35.76155739029704, 35.76241249100947,
35.76192112844663,
];
计算缩放比例
用 width / (Math.max(longitudes) - Math.min(longitudes)) 的作用计算 Polygon 的 x 轴缩放比例 xScale = 67369.49567346855
height 同理,计算出 y 轴的缩放比例 yScale = 12905.23981205731
总的缩放比例 scale 采用 xScale、yScale 谁小用谁,为 scale = 12905.23981205731,因为用小的缩放比例,才能在有限的空间下显示全
const calcScale = ({
  longitudes,
  latitudes,
}: {
  longitudes: number[];
  latitudes: number[];
}) => {
  const xScale =
    width / Math.abs(Math.max(...longitudes) - Math.min(...longitudes));
  const yScale =
    height / Math.abs(Math.max(...latitudes) - Math.min(...latitudes));
  return xScale < yScale ? xScale : yScale;
};
计算偏移度
(Math.max(longitudes) - Math.min(longitudes)) * scale 作用是将经度按照 scale 进行缩放,纬度也是同理
在用 width 和 height 去减,分别得到要 x 轴和 y 轴需要偏移的空间
这些空间要分布在两边,也就是说要分布 Polygon的周围,所以左后需要除 2,最终得到 xOffset = 32.33763608704606,yOffset = -8.881784197001252e-16
const calcOffset = (
  { longitudes, latitudes }: { longitudes: number[]; latitudes: number[] },
  scale: number
) => {
  const xOffset =
    (width -
      Math.abs(Math.max(...longitudes) - Math.min(...longitudes)) * scale) /
    2;
  const yOffset =
    (height -
      Math.abs(Math.max(...latitudes) - Math.min(...latitudes)) * scale) /
    2;
  return { xOffset, yOffset };
};
将 Coordinates 进行缩放
对 coordinates 缩放一共分为 3 步
比较难理解的是第一步,为什么要将每个点去减它的最小值 item[0] - Math.min(...longitudes)
这样做的目的是为了那个点无限接近于原点,接近原点后,再通过乘以缩放比例和加上偏移度,得到最终的的缩放值
在需求分析时说了,屏幕的原点在左上角,地图的原点在左下角,所以 y 轴是刚好是相反,y 轴就用 Math.max(...latitudes) - item[1]
const scaleCoordinates = (
  coordinates: number[][][],
  scale: number,
  offset: ReturnType,
  { longitudes, latitudes }: { longitudes: number[]; latitudes: number[] }
) => {
  return coordinates[0]
    .map((item) => {
      item[0] = item[0] - Math.min(...longitudes);
      item[1] = Math.max(...latitudes) - item[1];
      return item;
    })
    .map((item) => {
      item[0] = item[0] * scale;
      item[1] = item[1] * scale;
      return item;
    })
    .map((item) => {
      item[0] = item[0] + offset.xOffset;
      item[1] = item[1] + offset.yOffset;
      return item;
    });
};
使用 Canvas 进行绘制
const canvas = document.getElementById("canvas");
if (!canvas.getContext) return;
const ctx = canvas!.getContext("2d")!;
ctx.fillStyle = "rgba(32, 210, 255, 0.3)";
ctx.strokeStyle = "rgba(32, 210, 255, 1)";
ctx.beginPath();
ctx.moveTo(coordinates[0][0], coordinates[0][1]);
for (let i = 1; i < coordinates.length; i++) {
  ctx.lineTo(coordinates[i][0], coordinates[i][1]);
}
ctx.closePath();
ctx.stroke();
ctx.fill();
存在问题
无法区分 Polygon 大小,所以这个方案适用于绘制缩略图
以上就是Canvas中绘制Geojson数据示例详解的详细内容,更多关于Canvas绘制Geojson数据的资料请关注脚本之家其它相关文章!
